
Introduction:
International Monetary Fund (IMF) has described India as one of the world’s fastest-growing economies and a key engine of global growth. In August 2026, S&P Global Ratings affirmed India’s ‘BBB/A-2’ sovereign ratings with a Stable Outlook. This followed the upgrade of its long-term rating to ‘BBB’ in 2025, after an 18-year gap.
What does each term means?
-
- GDP (Gross Domestic Product): The value of all final goods and services made inside India in a given period.
- GVA (Gross Value Added): Measures what each sector or producer adds to the economy. GDP = GVA plus taxes on products minus subsidies.
- Real vs Nominal: Real GDP removes the effect of price rise (inflation). Nominal GDP does not. Real growth tells you the true rise in output; nominal growth mixes in price rise too.
- Base year: The reference year used to calculate real growth. India moved its base year to 2022-23 in 2026, its 8th such revision since Independence.
- Double Deflation:Under the double-deflation approach, output and intermediate consumption of the manufacturing sector are deflated separately. The real GVA is obtained as real output minus real intermediate consumption.
|
The Headline Numbers: Q1 FY2026-27
-
- Real GDP: ₹81.36 lakh crore, up 7.8%, against 6.9% in Q1 FY2025-26. This beat the RBI’s own forecast of 7.0% for the quarter.
- Nominal GDP: ₹88.27 lakh crore, up 10.3%, against 8.1% last year.
- Real GVA: ₹73.82 lakh crore, up 8.2%, against 7.0% last year.
- Revised estimates: MoSPI also revised past years upward: 2023-24 to 7.3% (from 7.2%), 2024-25 to 7.2% (from 7.1%), and 2025-26 to 7.8% (from 7.7%), using the new 2022-23 base year and updated price indices.
What Powered the Growth?
-
- Investment (GFCF): Grew 11.9%, up sharply from 5.8% a year ago. This is the strongest driver this quarter.
- Household spending (PFCE): Grew 7.1%, only a little faster than 6.8% last year. Consumption is steady, not surging.
- Exports: Grew 12.0%, up from 6.0% last year, helped by a 13.16% rise in combined exports during April-July.
- Sectors: Tertiary (services) sector grew 10.0%; secondary (industry) sector grew 8.6%; manufacturing alone grew 9.2%, with electrical equipment (27.0%) and other transport equipment (19.5%) leading the IIP gains.
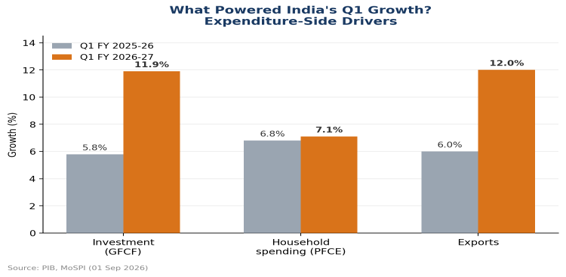
Fig. 1 – Investment and exports grew far faster than household spending this quarter.
Other Signs of Momentum
-
- Industrial production: Grew 6.7% in July 2026, up from 5.4% a year earlier. Capital goods output surged 16.1%.
- Index of Core Industries: Grew 5.4% in July 2026; up 4.3% for April-July, against just 1.5% last year.
- Exports: Combined goods and services exports hit US$80.14 billion in July 2026, up 13.31% year-on-year.
- Credit growth: Bank credit to agriculture rose 17.0%, to industry 20.0%, and to services 22.9% in July 2026, all much faster than a year ago.
- Global validation: The IMF called India one of the world’s fastest-growing economies in July 2026. S&P Global affirmed India’s ‘BBB/A-2’ rating with a Stable Outlook in August 2026, after upgrading it to ‘BBB’ in 2025 for the first time in 18 years.
Key Policy Measures Behind the Momentum
-
- Manufacturing: Mobile Phone Manufacturing Scheme (₹62,500 crore), Semicon 2.0 (₹1,27,500 crore), BHAVYA Rasayan Scheme for chemical parks (₹3,030 crore), ECLGS 5.0 for MSME credit and MSME Development (Amendment) Bill, 2026.
- Energy security: Samudra Manthan for offshore exploration (₹84,084 crore), coal gasification support (₹37,500 crore), GOBARdhan for biogas (₹23,731 crore) and PM-Surya Sarovar for floating solar (₹5,070 crore).
- Trade and investment: India-UK CETA in force from 15 July 2026 & India-Israel Bilateral Investment Agreement from 4 July 2026. It is wider FPI access to government securities; the Bharat Maritime Insurance Pool (₹12,980 crore sovereign guarantee).
- Agriculture: PM-KISAN extended to 2030-31 (₹3.15 lakh crore) & higher MSP for 14 Kharif crops; Mission for Cotton Productivity (₹5,659.22 crore); National Investment Policy for Urea-2026.
Comparative View- How Does India Stack Up Globally?
A growth rate only means something next to a benchmark. Here is India’s Q1 print against IMF’s own April 2026 forecasts for the rest of the world.
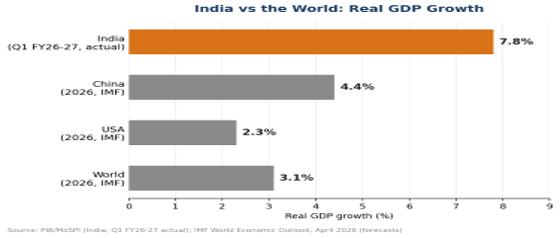
Fig. 2 – India’s quarterly growth print comfortably outpaces full-year global forecasts.
What This Comparison Really Teaches
-
- Growth leadership is relative, not absolute: The IMF projects global growth slowing to 3.1% in 2026, partly due to Middle East tensions. India growing at more than double that rate is a genuine global standout.
- China’s growth is now structurally lower: At 4.4%, China’s growth is supported by policy stimulus, not the double-digit expansion it once had. This is part of why global investors are looking more closely at India.
- Fast growth does not automatically mean high living standards: India’s economy is still much smaller than the US or China in absolute size. A high growth rate on a smaller base is a different achievement than the size and depth of the American or Chinese economy.
Significance of this
-
- Strong, broad-based growth supports jobs, tax revenue and India’s global bargaining power in trade talks.
- Investment-led growth (GFCF up 11.9%) builds future productive capacity, not just short-term demand.
- A stable sovereign rating (S&P’s ‘BBB’, Stable Outlook) lowers India’s borrowing costs and attracts foreign capital.
- Rising credit growth across agriculture, industry and services suggests confidence is spreading beyond just a few sectors.
Counter view of this:
-
- IMF’s National Accounts assessment (November 2025) downgraded India’s national accounts data to a ‘C’ grade, citing concerns over how outdated the earlier base year had become. The 2022-23 rebasing was partly a response to this.
- Former Chief Economic Adviser Arvind Subramanian and other independent economists have argued that India’s GDP numbers may overstate real growth. Pointing to a gap between reported nominal and real growth that implies unusually low inflation.
- ICRA’s chief economist, Aditi Nayar noted that the 2022-23 rebasing trimmed nominal GDP by more than ₹11 lakh crore compared to the old series, which could push India’s fiscal deficit ratio higher than Budget assumed, since the deficit is measured as a share of GDP.
- ISAS (Institute of South Asian Studies) analysis (January 2026) flagged that headline GDP growth diverges from other indicators. It record-low foreign direct investment in some periods, stagnant manufacturing employment and a mismatch between corporate revenue growth and GDP growth.
- The Ministry of Statistics and Programme Implementation’s own response to critics has defended revisions as reflecting better data sources and a more representative post-pandemic base year not an attempt to inflate the numbers.
Way Forward:
-
- MoSPI should keep publishing a detailed, transparent reconciliation between the old and new GDP series, so analysts and international bodies like the IMF can rebuild confidence in India’s statistics over time.
- Finance Ministry should factor the lower rebased nominal GDP into fiscal deficit targeting, to avoid an accidental, statistics-driven miss on the deficit goal.
- Government should track and publish employment and wage data alongside GDP data every quarter, so growth data and job data are seen together, addressing the ‘jobless growth’ criticism directly.
- RBI and Finance Ministry should keep supporting investment-led growth (visible in the 11.9% GFCF rise) with stable interest rates and credit access. Since investment today becomes capacity and jobs tomorrow.
- Ministry of Commerce should build on the 12.0% export growth by deepening new FTAs (UK, Israel) and widening market access further. Since exports are currently one of the strongest growth engines.
Conclusion:
India’s economic performance at the start of 2026-27 reflects broad-based momentum across key areas of the economy. Investment has accelerated, household consumption has remained firm, while manufacturing, services and exports have provided additional support.
Spread the Word