THE CONTEXT: Recently NITI Aayog released the second edition of the Multidimensional Poverty Index (MPI), ‘National Multidimensional Poverty Index: A Progress of Review 2023’. India has registered a significant decline of 9.89% in a number of India’s multidimensionally poor from 24.85% in 2015-16 to 14.96% in 2019-21, as per the report.
BACKGROUND OF POVERTY ESTIMATION
- The estimation of poverty or prosperity has received considerable institutional and academic attention over the years.
- In India, the pioneering work was perhaps Dadabhai Naoroji’s Poverty and unBritish Rule in India. Subsequently, several experts Dandekar & Rath (1971); Alagh (1979); Lakdawala (1993); Tendulkar (2009) have all attempted to answer the question of the numbers in poverty.
- Historically, poverty has traditionally been measured against a defined standard/level. However, the intensity of poverty can vary even within that standard, which itself is a subject of much debate.
THE MULTIDIMENSIONAL POVERTY INDEX (MPI)
- The National Multidimensional Poverty Index is modelled on the Global Multidimensional Poverty Index, which is jointly published by the Oxford Poverty and Human Development Initiative (OPHI) and the United Nations Development Programme (UNDP).
- The NITI Aayog is the nodal agency for the Multidimensional Poverty Index (MPI).
- It ranks States and Union Territories based on their performance and has also constituted an inter-ministerial MPI Coordination Committee (MPICC) to consult twelve Line Ministries mapped to each National MPI indicator.
- The National MPI Project is aimed at deconstructing the Global MPI and creating a globally aligned and yet customised India MPI for drawing up comprehensive Reform Action Plans with the larger goal of improving India’s position in the Global MPI rankings.
- It captures overlapping deprivations in health, education and living standards and other broader qualitative aspects of life, like child mortality, housing conditions, and other basic services such as water and sanitation to ascertain multidimensional poverty.
THE METHODOLOGY
- The index is calculated using 12 indicators gathered from the National Family Health Survey (NFHS) reports from 2015-16 and 2019-21 (one-year gap due to Covid). NFHS is conducted by the International Institute for Population Sciences (IIPS) under the Ministry of Health and Family Welfare, Government of India.
- The Baseline Report of MPI is based on the National Family Health Survey (NFHS) 4 taken up during 2015-16 and National Family Health Survey-5 (NFHS-5) during 2019-21.
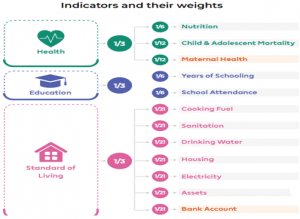
- The National MPI measures simultaneous deprivations across three equally weighted dimensions of health, education, and standard of living that are represented by 12 sustainable development goal (SDG) aligned indicators.
- Each of these specific parameters is assigned a value to calculate what is called a ‘deprivation score. The deprivation score is the sum of the weighted status of all the indicators for an individual if it is more than 0.33, only then an individual is considered multidimensionally poor.
- Change in multidimensional poverty is then obtained by comparing the data from the fifth National Family Health Survey (NHFS5) (2019–21) with data from NHFS4 (2015–16).
HIGHLIGHTS OF THE NATIONAL MPI REPORT 2023
DECLINE IN POVERTY
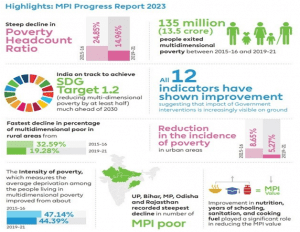
- India has registered a decline in the number of “multidimensionally poor” individuals, from 24.85 per cent in 2015-16 to 14.96 per cent in 2019-2021.
- India witnessed 13.5 crore people moving out of multidimensional poverty between 2015-16 and 2019-21 due to improvements in indicators like access to cooking fuel, sanitation, drinking water, and bank accounts, among others.
SIGNIFICANT IMPROVEMENT IN INDICATORS
- In the five years, the MPI value halved from 0.117 to 0.066 and intensity of poverty reduced from 47% to 44%, thereby setting India on the path of achieving the SDG target 1.2 (of reducing multidimensional poverty by at least half) much ahead of the stipulated timeline of 2030.
- All 12 parameters of the MPI have shown marked improvements in the report.
- Niti Aayog said the government’s dedicated focus on improving access to sanitation, nutrition, cooking fuel, financial inclusion, drinking water, and electricity has led to significant advancements in these areas.
MULTIDIMENSIONAL POVERTY IN STATES
- Providing multidimensional poverty estimates for the 36 States and Union Territories, and 707 administrative districts, the report said the fastest reduction in the proportion of multidimensional poor was observed in Uttar Pradesh, Bihar, Madhya Pradesh, Odisha, and Rajasthan.
- Bihar, Uttar Pradesh, Jharkhand, and Meghalaya made headlines for having the highest proportion of multidimensionally poor people among their respective total populations. However, these states had also shown the maximum decline in poverty.
- On the other hand, Kerala, Goa, Tamil Nadu, Sikkim, and Punjab are the states with the lowest proportion of multidimensionally poor people as compared to their total populations.
LESS THAN 10% MULTIDIMENSIONAL POVERTY IN INDIAN STATES
- Indian states with less than 10% multidimensional poverty doubled in 5 yrs. According to the report, in 2015-16 (NFHS-4), only seven states had less than 10 per cent of their population living in multidimensional poverty Mizoram, Himachal Pradesh, Punjab, Sikkim, Tamil Nadu, Goa, and Kerala.
- However, in 2019-21 (NFHS-5), the list had doubled to include 14 states, with the seven new additions being Telangana, Andhra Pradesh, Haryana, Karnataka, Maharashtra, Manipur, and Uttarakhand.
- All of these states saw a significant reduction in poverty headcount ratio, except for Bihar; no other state in India has more than one-third of its population living in multidimensional poverty.
IMPROVEMENT IN RURAL POPULATION STANDARD OF LIVING
- The report released has clearly indicated that the rural populace has outclassed their urban counterparts in the improvement of living standards.
- The multidimensional poverty in the rural areas has come down to 7.51% in 2019-21 from 19.51%, a decline of 12% against just about 2.2% in urban areas. Urban poverty, which was 4.92% in 2015-16, receded to 2.73% in 2019-21.
- The report said rural areas witnessed the fastest decline in poverty from 32.59% to 19.28%, while the urban areas saw a reduction in poverty from 8.65% to 5.27%.
COMPARATIVE ANALYSIS OF MPI OF NITI AAYOG WITH MPI OF UNDP
- Most of the indicators used for computing global MPI by the UN and national MPI by Niti Aayog are the same. Except for the fact that Niti Aayog takes into account two more factors, e. maternal mortality and opening of the bank accounts.
- MPI index of NITI Aayog takes into account health, education and standard of living but not income in any direct sense. Income could figure in the standard of living parameters, such as cooking fuel, sanitation, drinking water, housing, electricity and assets.
- In this respect, Unlike the MPI of NITI Aayog, which delves more into non-income factors in poverty, the UNDP’s HDI is modelled around per capita income, life expectancy at birth and mean years of schooling with equal emphasis on each.
- Both MPI of NITI Aayog and MPI of UNDP used NFHS-5 data. Still, there appears to be a data discrepancy between the MPI and India’s score in the UNDP’s human development index.
- On the one hand, MPI (Multi-dimensional poverty index) poor has fallen from 24.85 per cent in 2015-16 to 14.96 per cent in 2019-21, which translates into 135 million exiting poverty so defined over this period.
- On the other hand, the UNDP report says that although 415 million people moved out of MPI poverty between 2005-06 and 2019-21, 230 million or about 16.4 per cent of the population is still poor, an estimate slightly higher than the NITI Aayog’.
ISSUES IN THE INDEX
Even as there has been a significant reduction in the number of multidimensionally poor individuals, the index is embedded with several issues that need to be addressed.
POVERTY NOT EQUALLY REPRESENTED IN INDICATOR
- It is worth noting that one in seven Indians continue to fall under the category of multidimensional poor primarily because poverty reduction is not equally represented in the three main indicators of standard of living, health, and education.
LACK OF IMPROVEMENT IN INDICATORS
- Within the health category, three sub-indicators, nutrition, child and adolescent mortality, and maternal health, showed only moderate improvement.
- Similarly, while sanitation numbers have improved, more than 30 per cent of the population is deprived when it comes to sanitation services.
- Access to housing also remained to be an indicator where the improvement was only marginal.
ISSUE REGARDING CREDIBILITY OF DATA
- Even members of the Economic Advisory Council to the Prime Minister have raised doubts regarding the credibility of the data.
- According to them, the sample used in most of the surveys is incorrect since it is drawn from the dated 2011 census.
- The members argued that recent big changes are not being captured by the samples drawn from the 2011 census.
ISSUE IN MACRO DATA
- Macro data is already under suspicion as the largely unorganised non-agriculture sector (30 per cent of GDP and employing 48 per cent of the workforce) is not independently measured.
LEARNING GAP NOT CAPTURED
- The Annual Status of Education Report points to a huge learning gap, but this also goes uncaptured in the report.
- As a child may formally attend school but not effectively if the teacher is missing or hardly teaches.
RURAL-URBAN DIVIDE
- The Niti Aayog report says that though there has been a decline in the incidence of poverty, the urban-rural divide still remains a matter of concern.
- As the proportion of multidimensional poor was 19.28% of the Indian population, while in urban areas, it stood at 5.27% in 2019-21.
DIFFERING DATA
- Recently, the UNDP released the global multidimensional poverty index. It also used NFHS-5 data like the NITI Aayog report.
- However, according to the global MPI, the percentage of people living in multidimensional poverty in India is 16.4 as compared to 14.96% of the Niti Aayog.
- A difference of 1.44% points is significant in absolute numbers considering India’s high population.
NOT USING CORRECT STANDARDS
- Due to the absence of a consumption survey after 2012, the government is not measuring poverty properly.
- The government of India has not been able to tell citizens the number and share of the population below the consumption poverty line, which has been the traditional method of estimating poverty globally for decades.
- India has used consumption poverty as the measure for over four decades.
THE WAY FORWARD
- Conducting a timely Census: Census is a crucial exercise for better policy making, which provides correct data if a timely conducted. The government is unduly delaying the census, and there is a need to fasten the process.
- Using Standard method: There is a need to upgrade the methodology and start using the standard method. For example, for the poor, only PPP are not relevant; they mask their true poverty. For them, the metric of the ‘nominal dollar’ is more appropriate. Thus, most of the unorganised sector is way below the poverty line. Nominal dollars (also referred to as actual dollars) represent the actual amount of money spent or earned in a given year. Rather than employing a standard income-based approach, it uses statistics from the National Family Health Survey (NFHS) to capture the various dimensions of poverty in India.
- Contribution towards Instituting Public Policy tool: The use of an index in establishing a public policy tool to monitor multidimensional poverty and informed, evidence-based, and targeted interventions will ensure that no one is left behind.
- To provide an Overview of Poverty: This year’s Multidimensional Poverty Index (MPI) reminds us of the need for a complete picture of how people are being affected by poverty. There is a need to design effective responses while also allowing for more detailed and in-depth analyses of areas of interest, such as regions states, or districts, and specific sectors, to supplement existing monetary poverty statistics.
- Contribute to the achievement of the SDGs: Properly measuring and working on the issues of poverty will help achieve the measuring progress toward Sustainable Development Goal (SDG) target 1.2, which aims to reduce “at least by half the proportion of men, women, and children of all ages living in poverty in all its dimensions.”
THE CONCLUSION: Though the recently released 2nd edition of the MPI report has shown significant improvement in its indicators which contributed to the decline in poverty. However, the conclusions of the report have several lacunae which need reinterpretation to achieve long-term SDG goals with proper policy interventions.
MAINS QUESTIONS
Q.1 Define Multidimensional Poverty. Explain the policies and initiatives taken by the government to tackle this with relevant examples.
Q.2 Despite the measures by the government, one in seven Indians are bracketed as multidimensional poor. Highlight the reasons behind this situation in India and suggest measures.
Spread the Word