THE CONTEXT: India’s external sector has been buffeted by shocks and uncertainty manifested in terms of elevated, though now easing global commodity prices; tightening international financial conditions; heightening financial market volatility; reversal of capital flows; currency depreciation and looming global growth and trade slowdown. However, it has been able to face these headwinds from a position of strength on the back of strong macroeconomic fundamentals and buffers.
TRADE HELPING INDIA REAP THE BENEFITS OF GLOBALIZED WORLD
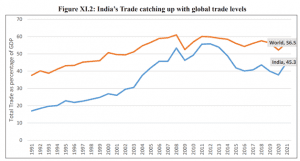
- For the world as a whole, the share of trade as a percentage of world GDP has been in the range of 50-60 per cent since 2003 and stood at 52 per cent in 2020, according to the World Bank database.
- For India as well, the share of trade as a percentage of GDP has been steadily increasing, being above 40 per cent since 2005 (except 2020 being the pandemic year). The ratio stands at 46 per cent in 2021 and 50 per cent for H1 of 2022.
Global Scenario
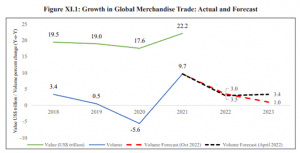
- The global trade volume grew by 4.8 per cent in H1 2022, on top of an impressive recovery of 9.7 per cent in 2021, as per the World Trade Organisation (WTO) statistics. The global merchandise trade in value terms rose year-on-year (YoY), by 22.2 per cent in 2021, reversing the deceleration observed in the previous three years. During the H1 of 2022, the trade-in value terms grew by 32 per cent compared to the corresponding period of 2019.
- Trade growth is likely to slow in the closing months of 2022 and into 2023, according to the WTO Goods Trade Barometer.
India’s growing and diversifying trade
- International trade has been an important pillar of the resilience of India’s external sector. Trade as a percentage of GDP for India was in the range of 12-15 per cent in the 1980s; 16-25 per cent in the 1990s and 25-50 per cent in the 2000s.
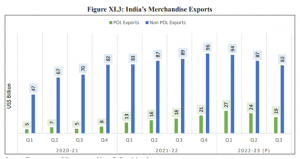
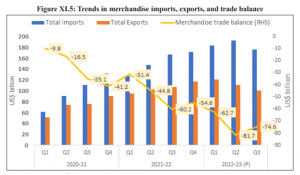
- India achieved an all-time high annual merchandise export of US$ 422.0 billion in FY22.
- Merchandise exports were US$ 332.8 billion over April-December 2022 against US$ 305.0 billion during the period April-December 2021. Nonpetroleum and non-gems & jewellery exports in April-December 2022 were US$ 233.5 billion, as compared to US$ 230.0 billion in April-December 2021.
Bright spots in India’s Trade performance
- India’s pharma exports: US$ 15.4 billion in FY15 to US$ 24.6 billion in FY22
- Electronic goods exports: US$ 11.0 billion during April-December 2021 to US$ 16.7 billion during April-December. 2022 .
- Engineering goods exports crossed the US$ 100 billion mark in FY22 for the first time.
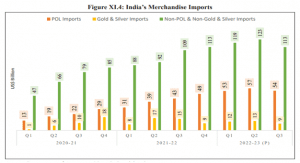
- Merchandise imports for the period April-December 2022 were US$ 551.7 billion as against US$ 441.5 billion
- Among major import commodities, petroleum crude & products imports increased by 45.6 per cent to US$ 163.9 billion in April-December 2022 compared to US$ 112.6 billion in April-December 2021 and continue to be the highest imported commodity.
- The merchandise trade deficit for April-December 2022 was estimated at US$ 218.9 billion as against US$ 136.5 billion in April-December 2021.
- The USA remained the top export destination in April-November, 2022 followed by UAE and the Netherlands.
- As regards imports, China, UAE, USA, Russia, and Saudi Arabia have a joint share of 40 per cent of the total imports of India.
Trade in Services
- India’s services exports stood at US$ 254.5 billion in FY22 recording a growth of 23.5 per cent over FY21 and registered a growth of 32.7 per cent in April-September 2022 over the same period of FY22.
- Software and business services together constitute more than 60 per cent of India’s total services exports.
- Services imports rose by 25.1 per cent between FY22 and FY21 to reach US$ 147.0 billion and have registered growth of 36.7 per cent in April-September 2022 over the same period of FY22.
- The increase in services imports is mainly on account of payments for transport services, travel and other business services.
Foreign Trade Policy
- India’s Foreign Trade Policy (FTP) has, conventionally, been formulated for five years at a time.
- The latest FTP for 2015- 2020 is in vogue at present. To provide policy stability during the pandemic period, the five-year FTP 2015-20 was extended from 2020 to 2022. The policy has been further extended till March 2023.
- In the year 2022, India signed Free Trade Agreements (FTAs) with UAE and with Australia to provide greater market access with a reduction in tariff and non-tariff barriers.
International Trade Settlement in Indian Rupees
- In July 2022, the Reserve Bank of India (RBI) issued a circular permitting an additional arrangement for invoicing, payment, and settlement of exports/imports in Indian Rupees (INR) to promote the growth of global trade.
- The above-mentioned framework for international settlement in INR acquires significance against the backdrop of the US Fed aggressively hiking the policy rates and its hawkish stand, the consequent rallying of the US dollar to multi-decade high levels, and concomitant weakening of currencies of various EMEs including the INR.
- The INR accounted for 1.6 per cent. If the INR turnover rises to equal the share of non-US, non-Euro currencies in global forex turnover of 4 per cent, INR could be regarded as an international currency, reflecting India’s position in the global economy.
Initiatives to enhance trade
- Focus on Agricultural Products: India’s agricultural exports achieved the highest ever export in FY22 reaching US$ 37.8 billion and it continued to perform well in FY23 with exports of US$ 26.8 billion during April- November 2022 backed by an effective agriculture export policy.
- Interest Equalisation Scheme: This Scheme was formulated to give benefit in the interest rates being charged by the banks to the exporters on their pre- and post-shipment rupee export credits.
- Remission of Duties and Taxes on Exported Products (RoDTEP) scheme: The scheme seeks remission of Central, State and Local duties/taxes/levies at different stages at the Central, State, and local level.
- Export Credit Guarantee: The Export Credit Guarantee Corporation (ECGC) supports Indian exporters and banks by providing export credit insurance services.
- Krishi Udan Scheme: Krishi Udan Scheme was launched in August 2020 on international and national routes to assist farmers in transporting agricultural products so that it improves their value realization. Krishi Udan 2.0 was launched in October 2021.
- Trade Infrastructure for Export Scheme: The creation of appropriate infrastructure for the growth of exports from the States.
- Districts as Export Hubs – One District One Product Initiative: The Districts as Export Hubs-ODOP initiative is aimed at targeting export promotion, manufacturing, and employment generation.
India’s Global Trade Engagements
- Governments have been pursuing international trade cooperation largely driven by diverse external and internal political economy considerations such as promoting peace and stability, increasing market size and most importantly, insuring themselves against unfavourable trade policies of other countries.
- The economic rationale for FTAs was the diversification and expansion of India’s exports to its trading partners, providing a level playing field vis-à-vis the competing countries having preferential access in our trading partners.
- India has so far concluded 13 FTAs and 6 Preferential Trade Agreements (PTAs).
BALANCE OF PAYMENTS IN CHALLENGING TIMES
Current Account Balance
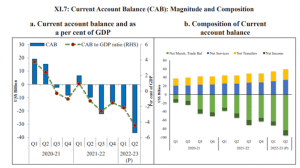
- India’s current account balance (CAB) recorded a deficit of US$ 36.4 billion (4.4 per cent of GDP) in Q2FY23 in contrast to a deficit of US$ 9.7 billion (1.3 per cent of GDP) during the corresponding period of the previous year.
- For the period April- September 2022 (H1FY23), India recorded a CAD of 3.3 per cent of GDP on the back of an increase in the merchandise trade deficit, as compared with 0.2 per cent in H1FY22.
Invisibles
- Net services receipts increased from US$ 51.4 billion in H1FY22 to US$ 65.5 billion in H1FY23.
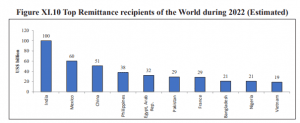
- Remittances anticipated to reach a milestone of US$100 billion in 2022 according to the World Bank.
Capital Account Balance
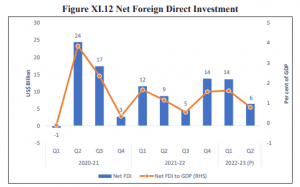
- On a BoP basis, the net capital inflows declined to US$ 29.0 billion in H1FY23 from US$ 65.0 billion19 in H1FY22 primarily driven by the FPI outflow of US$ 14.6 billion in Q1FY23. Net FDI inflows at US$ 20.0 billion in H1FY23 were comparable with US$ 20.3 billion in H1FY22.
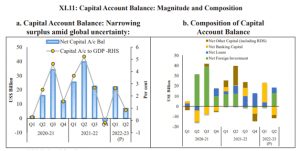
- In terms of FDI inflow, Singapore was the top investing country with a 37.0 per cent share, followed by Mauritius (12.1 per cent), UAE (11.0 per cent), and the USA (10.0 per cent).
- Foreign Portfolio Investments (FPIs) recorded a net outflow of US$ 2.5 billion during April-December 2022 as against an outflow of US$ 0.6 billion a year ago.
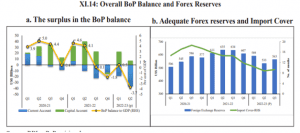
Balance of Payments and Foreign Exchange Reserves
- There was a depletion of foreign exchange reserves on a BoP basis to the tune of US$ 25.8 billion in H1FY23 in contrast to an accretion of US$ 63.1 billion in H1FY22. But huge valuation losses (US$ 48.9 billion) contributed to the net depletion of US$ 74.6 billion of reserves in nominal terms during the period.
- As of end-November 2022, India was the sixth largest foreign exchange reserves holder in the world according to data compiled by the IMF.
- India’s foreign exchange reserves stood at US$ 562.7 billion as of end December 2022 covering 9.3 months of imports.
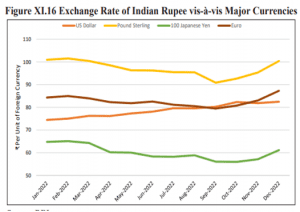
EXCHANGE RATES MOVING IN TANDEM WITH GLOBAL DEVELOPMENTS
- The INR appreciated against select major currencies barring the US dollar. The average exchange rate of INR against the Pound Sterling appreciated by 6.7 per cent in April -December 2022 over April – December 2021. This rate of appreciation was 14.5 per cent with respect to the Japanese Yen and 6.4 per cent against the Euro.
INTERNATIONAL INVESTMENT POSITION: A REFLECTION OF INDIA’S FINANCIAL SOUNDNESS
- As of end-September 2022, Indian residents’ overseas financial assets at US$ 847.5 billion were lower by US$ 73.0 billion or 7.9 per cent compared to the level as of March 2022, mainly due to the reduction in reserve assets even as trade credit and overseas direct investment recorded an increase.
- Reserve assets at US$ 532.7 billion, accounting for around 62.9 per cent of India’s international financial assets fell by 12.3 per cent over the same period.
- International liabilities at US$ 1,237.1 billion as of end-September 2022 were lower by US$ 41.6 billion (3.2 per cent) as compared to the level as of end-March 2022.

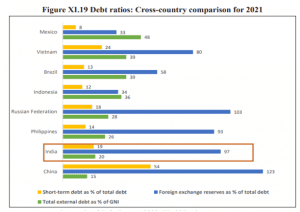
SAFE AND SOUND EXTERNAL DEBT SITUATION
- India’s external debt, at US$ 610.5 billion as of end-September 2022, grew by 1.3 per cent (US$ 7.6 billion) over US$ 602.9 billion as of end-September 2021. However, external debt as a ratio to GDP fell to 19.2 per cent as of end-September 2022 from 20.3 per cent a year ago.
THE OUTLOOK FOR THE EXTERNAL SECTOR: CAUTIOUS AMIDST GLOBAL HEADWINDS
- Slowing global demand is weighing on India’s merchandise exports. Thus, the export outlook may remain flat in the coming year if global growth does not pick up in 2023.
- In such cases, product basket and destination diversification which India is taking through FTAs would be useful to enhance trade opportunities. Governments can try and open markets through FTAs.
- India is facing competition from South Asian countries in a few of its export competitive products. However, given the benefits of the lower average age of the working population along with the advantage of economies of scale, India has the potential to cater to the global demand for several products in a cost-effective manner. For example, in the textile sector, Bangladesh and Vietnam are seen to be expanding their exports globally, in recent years.
- India is cementing its position as the top remittance receiver in the world, with inward remittances projected to be at record levels during 2022; the CAD would be within manageable limits and eminently financeable.
- The forex reserves remained comfortable at US$ 562.7 billion as of end-December 2022, covering 9.3 months of imports. The stock of India’s external debt has been prudently managed.
- From a cross-country perspective too, India’s external sector has fared relatively better and hence positioned relatively stronger to face the evolving adverse global scenario as evidenced by the Indian rupee outperforming most currencies, comfortable import cover and moderate CAD. India’s external debt vulnerability indicators are benign by international standards.
- To sum up, while India’s external sector faces challenges, it is performing relatively better as compared to many of its peers as it has inbuilt shock absorbers to weather them.