THE CONTEXT: India clocked in year-on year GDP growth as of this financial year’s April-June quarter (Q1), 2023 at 7.8%, according to the National Statistical Office (NSO), but there is allegation that the government is favoring the higher estimate of GDP by using a statistical tool called ‘discrepancy’. Following article explain how GDP is calculated in India and associated issues from UPSC CSE PERSPECTIVE.
CURRENT ISSUE IN DEBATE
- After the release of National Statistical Office (NSO) data it created controversy over GDP data. Here, Opposition alleged that the Q1 GDP data was overstating the GDP by a full percentage point.
- Another criticism came from some economists who pointed to the two main ways in which India calculates its GDP and argued that they did not match up and alleged that government is favouring the higher estimate of GDP by using a statistical tool called “discrepancy”.
- As consumers, most Indians might find a real GDP growth rate of 7.8% an obvious That’s because the retail inflation rate in these three months was 4.7%, 4.3% and 4.9%, respectively.
- If one was to “deflate” nominal GDP using consumer price inflation, the real GDP would fall to less than 4%.
- But then if one goes by wholesale inflation, the real GDP will actually be much higher than 8%. That’s because wholesale inflation was negative in all the three months -0.8%, -3.6%, and -4.2%, respectively.
- The fact is that India’s inflation indices need to be updated. In particular, experts have been repeatedly arguing that the wholesale price index must be discarded altogether in favour of a new Producer Price Index.
- Presently WPI is collected and processed by the Department of Commerce and Industry and largely follows the IIP (Index of Industrial Production) frame, which itself is subject to criticism.
- Moreover, WPI does not provide information on rural and urban as well as the state level estimates, which are all relevant for public policy.
- Again, one would expect that the discrepancy level (as a percentage of the total GDP) would be higher in quarterly GDP estimates and lower in annual GDP estimates because with time, more reliable data is available and estimates can be expected to come close to each other.
- However, the credibility of India’s GDP estimates depends on the quality of underlying data be it the WPI inflation or consumer expenditure or Index of Industrial Production (IIP). Hence, policymakers need to address the quality of Indian macroeconomic data to ensure credibility of India’s GDP estimates.
GDP AND ITS CALCULATION METHOD
- The GDP is the most basic way to assess the performance and size of any economy both from one year to another as well as across different countries. Technically GDP is defined as the total market value of all final goods and services in an economy.
- Real GDP versus Nominal GDP: The overall GDP that one observes by adding up the market value is called the nominal GDP. But to arrive at the real GDP, statisticians remove the effect of price inflation from nominal GDP. This is done by using what is called a GDP deflator or price deflator.
HOW IS GDP CALCULATED?
- The current GDP estimates place India as the fifth largest economy in the world. However, it is estimated that India is on the path to becoming the third-largest economy around 2027.
- The primary responsibility for the measurement of GDP is with the Ministry of Statistics and Programme Implementation.
- The country’s GDP is presently computed with the base year of 2011-12.
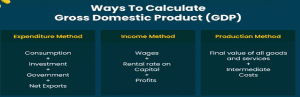
Three ways to calculate GDP. These methods are:
1. The Output Method (all value added by each producer)
2. The Income Method (all income generated)
3. The Expenditure Method (all spending)
Output Method
The Output Method measures GDP as the value of
- Output (what is produced)
- minus the value of goods and services used up in producing these outputs (the inputs or Intermediate Consumption)
- plus, all Taxes on Products like VAT
- minus all Subsidies on Products like renewable energy subsidies
Income Method
The income method measures GDP by adding together:
- The Gross Profit of companies and the Self-Employed
- plus the wages of employees (Compensation of Employees)
- plus all Taxes on Products like VAT
- minus all (like renewable energy subsidies)
Expenditure Method
In the expenditure approach, as the name implies, we measure how much is spent on goods and services. It is important that spending is only counted once. We estimate:
- Consumer spending by individuals (Personal Consumption Expenditure)
- plus Net Expenditure by Central and Local Government
- plus all Capital Spending (such as buildings and machines)
- plus Net Exports
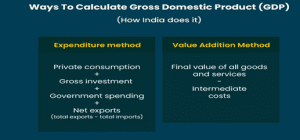
HOW IS GDP CALCULATED IN INDIA?
- To assess India’s productivity, the GDP is calculated using the factor cost method across eight industries and the expenditure method is used to analyse how different areas of the economy are performing.
- There are four parts to the expenditure method: i) Private Consumption ii) Gross Investment iii) Government Spending iv) Net Exports
- Private consumption includes things like buying a car or eating out where only final consumption is considered.
- Gross investment is the total expenditure made for buying capital goods over a time period, without accounting for depreciation.
- Government purchases includes salary to employees, direct benefit transfer (DBT) payments, pensions, subsidies and other ways that the government spends its money for the public good.
- While calculating Net exports, the value of imports needs to be subtracted from the value of exports. Imports are already accounted for within the first part of the expenditure method, private consumption.
What is the factor cost method of calculating GDP?
The GVA figure of India’s economy is arrived at by calculating the net change in value for each sector over a designated time period.
The eight industry sectors that India considers are:
- Agriculture, forestry, and fishing
- Mining and quarrying
- Manufacturing
- Electricity, gas and water supply
- Construction
- Trade, hotels, transport, and communication
- Financing, insurance, real estate, and business services
- Community, social and personal services
The GDP number from the two methods may not be an exact match but the level of discrepancy should be minimal.
HOW GDP CALCULATION METHODOLOGY CHANGED IN INDIA AFTER 2015?
In 2015 Central Statistics Office (CSO) introduced few changes in the GDP calculation. They are mentioned below:
- Change of base year from 2004-2005 to 2011-2012: The change was done on recommendation of National Statistical Commission which had advised to revise the base year of all economic indices every five years.
- Replacing Factor Cost with Market Prices: The change was made to measure the GDP at basic prices i.e by the GVA method instead at factor cost. It includes not only the cost of production but also product subsidies and taxes. It was recommended by the United Nations System of National Accounts in 2008 which makes India’s GDP growth numbers comparable with that of developed nations in future.
- Broadening of data pool: The new data is pooled from the annual accounts of companies filed with the Ministry of Corporate Affairs (MCA21) which includes more than 5 lakh companies instead of earlier data from Annual Survey of Industries (ASI). It also takes into account the population census (2011), agriculture census (2010-11) and livestock census (2012). Also, there is improvement in coverage of financial corporations and in coverage of local bodies and autonomous institutions.
- Changes in calculation of agricultural income: Earlier data only included value added in farm produce, but the new data includes value addition in Livestock as well.
- Changes in calculation of labour income: In the changed method, Effective Labour Input (ELI) method is used which distinguishes workers on productivity by assigning weights to different categories of workers rather than earlier Labour Input (LI) method which used to had same parameter for each worker making them all equal.
WHY IS GDP USED BY MOST COUNTRIES AS A MEASURE OF NATIONAL INCOME ACCOUNTING?
GDP AS A MEASURE OF ECONOMIC WELL-BEING
- GDP is important because it gives information about the size of the economy and how an economy is performing.
- GDP serves as a gauge of our economy’s overall size and health.
- In broad terms, an increase in real GDP is interpreted as a sign that the economy is doing well.
- When compared with prior periods, GDP tells us whether the economy is expanding by producing more goods and services or contracting due to less output.
- Economists study GDP and related statistics to help inform their research.
INFORMED POLICY DECISIONS
- It provides valuable insights into the economy’s health and helps policymakers make informed fiscal and monetary policy decisions.
- Policymakers look to GDP when contemplating decisions on interest rates, tax and trade policies. Policymakers can use GDP data to guide fiscal and monetary policy decisions.
- State and local governments rely on GDP and similar statistics to help shape policy or decide how much public spending is affordable.
- For example, if GDP falls, policymakers may need to introduce policies to stimulate growth. Policymakers and investors can identify economic trends and patterns by comparing GDP data from one period to another.
STANDARD OF LIVING
- GDP is an important indicator of living standards, directly correlating with per capita income and household consumption.
- It measures how much output each person in the country contributes to the economy on average.
- GDP per capita measures a country’s economic output per person. It represents the total monetary value of goods and services generated within a country’s borders over a given period, divided by its total population.
INTERNATIONAL COMPARISON
- GDP data aids in comparing the economic performance of different countries and used as a benchmark for international comparisons and can influence decisions about investment and trade.
- By comparing GDP data across countries, policymakers and investors can identify economic strengths and weaknesses and make informed decisions.
- Most of the international institutions also uses GDP data for countries. For example, The World Bank and IMF provide annual GDP data for most countries.
- National statistical agencies provide official GDP data for their respective countries and may have more detailed information on the components of GDP.
EVALUATE INVESTMENT OPPORTUNITIES
- Investors can use GDP data to evaluate the potential for investment opportunities in different sectors of the economy.
- For example, a high GDP growth rate in a particular sector may suggest investment potential.
ISSUES IN GDP ESTIMATION
OUTDATED BASE YEAR
- The country’s GDP is presently computed with the base year of 2011-12 which is now more than 10 years old.
- GDP estimates based on an outdated base year would not adequately capture new activities being undertaken in the economy.
VARIATION IN GDP FIGURES DUE TO DISTINCT METHOD OF CALCULATION
- As India’s GDP is calculated using three methods.
- Each method produced distinct result led to variation in data due to their assessment method which create confusion.
DON’T TAKE INTO ACCOUNT SURVEYS
- Ministry of Statistics and Programme Implementation (MoSPI) has not come out with the results of various surveys like the consumer expenditure survey and the annual survey on unincorporated enterprises which are crucial for the base revision exercise.
IMPACT ON PUBLIC PERCEPTION
- Experts express concern that presenting an overly positive image of economic growth through GDP figures can mask the economic struggles and challenges faced by a significant portion of the population.
- This can impact public perception and policy decisions.
CANT ASSESS INCOME INEQUALITY
- GDP does not account for income distribution in any way i.e distribution of income amongst and within households or different economic classes in given societies is not captured by GDP data.
- Therefore, much of the work done by people today remains under-measured or largely unaccounted for.
- For most studies measuring and accounting for trends in income inequality, survey methods based on consumer spending and consumption behaviour are used and relied upon.
CANNOT CAPTURE WELL BEING AND GREEN GROWTH
- However, GDP has been the main way in which success has been measured but it is designed to measure only production capacity and economic growth.
- GDP was not designed to assess welfare or the well being of citizens. It does not capture green growth and environmental sustainability.
- Therefore, GDP is a limited measure of a country’s development success, as it ignores other important factors.
NO NEW FRESH SURVEYS
- New indicators are required based on fresh surveys. But no new survey of the unorganised sector has been conducted since 2015. Even the census has not been conducted in 2021.
- So the method used is seriously flawed. Finally, projecting the past annual numbers and dividing by four to get the quarterly figure is also seriously flawed when there is a shock to the economy at some point during the year.
DISCREPANCIES IN GDP CALCULATION
- An analysis of the GDP expenditure components reveals a concerning trend that there is an unexplained gap in the GDP calculation.
- It raises questions about the accuracy of the reported economic data.
DISREPANCY TOOL AND ITS CRITICISM
- Discrepancy is the difference between the two GDP estimates using expenditure and income method by GoI.
- India’s GDP is calculated mainly with two different methods: income method and expenditure method. However, the GDP figures from these two approaches may not be an exact match.
- There’s a subhead in the GDP data as ‘discrepancies’. It is used to explain any difference between the GDP calculated through the income and expenditure methods.
- These are not a category of GDP expenditure. These are a sum of errors in various expenditure categories.
- These do not spur growth of the economy as the other expenditures signify. Usually, discrepancies are supposed to be less than 1%. But, in recent years, in Indian data, these have been large.
- This presents a positive image of economic growth on the paper while underlying issues such as rising inequalities, job scarcity, and a decline in manufacturing.
- This led to an unexplained gap in the GDP calculation, which raises questions about the accuracy of the reported economic data.
- One of the other issue of difference is double counting issue in calculation of GDP. This is an error caused due to adding the value of a commodity twice once before adding value.
THE WAY FORWARD
- Revision of base year: There is need to revision of base year at least 2016-17 for which a complete assessment of various data sources presently used for compilation and an examination of the feasibility of using new sources of data is required. It is expected that revision of the base year would result in capturing of a lot of new activities being undertaken in recent years, due to both efforts of the present government and through private initiatives.
- Utilise surveys data: MoSPI must gear itself up to develop systems to be able to utilise surveys like the consumer expenditure survey and the annual survey on unincorporated enterprises. Also, the exercise to examine other available databases, especially the newly created databases from GST and digital payments, should commence immediately.
- Continuous cooperation: It requires continuous cooperation and action on the part of all the actors including the private sector, governments, policymakers and bureaucracy and the citizens through their active participation in the process of GDP calculation.
- Improvement in procedure: There are also requirements for improvements in the procedure for the compilation of GDP in the country. During the last base revision, an effort was made to introduce Supply Use Tables which are critical for the validation of national accounts statistics. Then it could not succeed, however with recent expertise it can be introduced.
- Scrutiny without bias: Intersectional mechanisms to validate growth figures require focus and empirical scrutiny that is independent from political and partisan bias. Such assessments with historical context and time-series validations may help the government to stop its obsessions with justifying short-term trends and focus on larger goals.
- New methodology: India’s GDP numbers need to be recalculated with a change in methodology. The argument that the discrepancies get evened out is not a strong one. To solve the discrepancies there is need of newer techniques to get accurate growth data.
THE CONCLUSION: Using GDP for an idea to economic development isn’t transcendental in nature nor it is an outcome of some perfectly imaginative goal but qualifies as a basic requirement for every social policy to achieve through outcomes. Therefore, policymakers need to address the concerns of India’s GDP estimates and should take suitable measures to incorporate other factors like sustainability to ensure its accuracy and credibility.
QUESTIONS
Q.1 Comment on the effectiveness of GDP as a measure of welfare of the people.
Q.2 Examine the methodology of GDP calculation in India how GDP is calculated in India. Why is it being used by countries as a measure of national income accounting despite its flaws? Suggest measures to ensure its credibility.
ADDITIONAL INFORMATION
GREEN GDP
- The concept of ‘Green GDP’ was coined in the late 1980s with aspiration to modify GDP to better reflect the impacts of economic activities on the environment. Green GDP takes into account the costs of environmental degradation and climate events.
- The “Green GDP” is derived from Net Domestic Product (NDP), – which is obtained by subtracting the depreciation of produced assets such as machines and buildings from GDP – by deducting the cost of depletion of natural resources and degradation of ecosystems.
- Green GDP = GDP – (Carbon dioxide damage + particulate emission damage) – (Opportunity cost of energy depletion + mineral depletion + net forest depletion) + Expenditure on environmental protection.
- It provides a practical and flexible approach for achieving concrete, measurable progress across its economic and environmental pillars, while taking full account of the social consequences of greening the growth dynamic of economies.
- The focus of Green GDP is ensuring that natural assets can deliver their full economic potential on a sustainable basis.
| Definition | Formula | |
| Gross Domestic Product (GDP) | GDP indicates the total value of all final goods and services manufactured within a country’s borders over time | GDP = C + I + G + NX (Expenditure Approach) OR
GDP = Monetary value of all products and services manufactured – Intermediate consumption (Production Approach).
|
| Gross National Product (GNP) | GNP refers to the value of all goods and services that a country’s residents produce, regardless of location, over a given period. | GNP = GDP + net income from abroad (income earned by residents of a country from foreign sources – income earned by foreigners in a country). |
| Gross National Income (GNI) | GNI measures a country’s residents’ total income, regardless of location, over a given period | GNI = GDP + net income from abroad (similar to GNP) – indirect taxes + subsidies. |
| Net National Product (NNP) | NNP is the monetary value of finished goods and services produced by a country’s citizens, overseas and domestically, in a given period. | NNP=Gross National Product−Depreciation |
| Net Domestic Product (NDP) | NDP is an annual measure of the economic output of a nation that is adjusted to account for depreciation. | NDP=GDP−Depreciation |