1. Index of Industrial Production (IIP)
-
- The Central Statistics Office (CSO), now part of the National Statistical Office (NSO) under the Ministry of Statistics and Programme Implementation, compiles and publishes the Index of Industrial Production (IIP) monthly.
- The IIP is a statistical measure of industrial performance, tracking the short-term changes in the volume of production of a basket of industrial products during a given period compared to a chosen base period (currently 2011-12).
Sectoral Weights in IIP:
-
- Mining Sector: 14.4%
- Manufacturing Sector: 77.6%
- Electricity Sector: 8%
The manufacturing sector carries the highest weight in the IIP.
2. Index of Eight Core Industries
This index measures the performance of eight core industries, which have a combined weight of 40.27% in the IIP.
Weights of Eight Core Industries:
| Industry | Weight |
|---|---|
| 1. Refinery products: | 28% |
| 2. Electricity: | 19.9% |
| 3. Steel: | 17.9% |
| 4. Coal: | 10.3% |
| 5. Crude oil: | 9% |
| 6. Natural gas: | 6.9% |
| 7. Cement: | 5.4% |
| 8. Fertilizers: | 2.6% |
3. Capacity Utilisation (CU) and RBI’s Business Expectation Index (BEI)
-
- Capacity Utilisation: An economic indicator assessing the demand and investment prospects of the economy, particularly in manufacturing. It tracks the pace of manufacturing activities.
- RBI’s Business Expectation Index (BEI): Provides a snapshot of demand conditions in the manufacturing sector, combining parameters like production, order books, raw material and finished goods inventory, profit margins, exports, and capacity utilization.
4. Annual Survey of Industries (ASI)
-
- Published annually by the CSO (now NSO), ASI provides industrial statistics related to the organized manufacturing sector in India.
Coverage
-
- Factories registered under the Factories Act, 1948 (factories employing 10+ workers using power, or 20+ workers without using power).
- Units with 100+ employees registered under various other acts.
- Bidi and cigar manufacturing establishments, all electricity undertakings not registered with the Central Electricity Authority.
Exclusions: Defense establishments, oil storage and distribution depots, departmental units such as railway workshops, and unorganized manufacturing sector data, which is compiled every five years.
Key Indicators:
Number of factories, employment, wages, invested capital, capital formation, input/output ratio, and value addition.
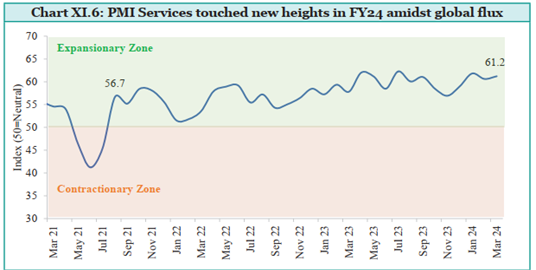
5. Purchasing Managers’ Index (PMI)
-
- Published by the Japanese firm Nikkei and compiled by IHS Markit Economics (S & P subsidiary).
- PMI is an indicator of the economic health of the manufacturing and services sectors.
- The PMI is a number from 0 to 100.
- A print above 50 means expansion, while a score below that denotes contraction.
- A reading at 50 indicates no change.
Types
- Manufacturing PMI
- Services PMI
Five Major Indicators: New orders, inventory levels, production, supplier deliveries, and employment environment.
Purpose: Provides information on current business conditions to decision-makers, analysts, and purchasing managers. India’s factory activity, reflected in PMI, showed robust growth post-pandemic.
Spread the Word