FARMING CONSENSUS: ON THE GOVERNMENT AND THE FARMERS ON PROTEST

THE CONTEXT: Farmers from Punjab in thousands have assembled at three points along the border with Haryana, where they have been stopped from marching to Delhi. The protesters have a range of demands including legally guaranteed MSP for crops.

MORE ON THE NEWS:

  • Some of these demands were raised during their earlier protest in 2021-22, which was called off after the central government withdrew three controversial laws that had sought to reform the agriculture sector.
  • The protest now is spearheaded by the Sanyukt Kisan Morcha (SKM) (non-political), a splinter group of the body that had led the earlier protest. The body has influence in the interest groups across Haryana, Punjab and western U.P. and Rajasthan.
  • There are at least three other strands of protests gathering strength.

1. Farmers in western U.P. affected by the Jewar airport project and Yamuna Expressway are up in arms.

2. In Haryana’s Sonipat, farmers are protesting land acquisition for power cables.

3. The original SKM and several trade unions have called for a national rural and industrial strike with overlapping and additional demands that include the repeal of four labour codes.

Demands of farmers:

  • The headline demand in the farmers’ 12-point agenda is for a law to guarantee MSP for all crops, and the determination of crop prices in accordance with the Dr M S Swaminathan Commission’s report.
  • The other demands are:

1. Full debt waiver for farmers and labourers

2. Implementation of the Land Acquisition Act of 2013, with provisions for written consent from farmers before acquisition, and compensation at 4 times the collector rate

3. Punishment for the perpetrators of the October 2021 Lakhimpur Kheri killings

4. India should withdraw from the World Trade Organization (WTO) and freeze all free trade agreements

5. Pensions for farmers and farm labourers

6. Compensation for farmers who died during the Delhi protest, including a job for one family member

7. The Electricity Amendment Bill 2020 should be scrapped

8. 200 (instead of 100) days’ employment under MGNREGA per year, daily wage of Rs 700, and scheme should be linked with farming;

9. National commission for spices such as chilli and turmeric; etc.

ISSUES:

  • Legal guarantee of MSP unlikely: The government has opened talks with the farmers but a legal guarantee of MSP appears unlikely as government is silent on this matter. The Union Ministry of Agriculture and Farmers Welfare notified a committee headed by former agriculture secretary Sanjay Agrawal to make the MSP more effective and transparent. However, the committee’s terms of reference also do not include any legal guarantee to MSP, which was one of the key demands of the farmers protest of 2020-2021.
  • Unsustainable farm practices: Surplus producers of grain have benefited from the MSP scheme, but the scheme bypasses subsistence farmers in poorer regions. This uneven geographical spread of procurement has also led to unsustainable farm practices in some areas.
  • Majority of farmers remain uncovered: According to a NSSO survey, less than 6% of Indian farmers i.e over 9 crore agricultural households have benefited directly from selling their wheat or rice under the MSP regime.
  • Procurement is concentrated in a few states:The procurement of grains is concentrated only in a few states. For example, Punjab, Haryana, western UP, Chhattisgarh and Telangana for paddy; Telangana and Maharashtra for cotton, etc.
  • Poor implementation of the MS Swaminathan Commission recommendations: It recommended that MSP should be at least 50% more than the weighted average cost of production which is not in the sight of implementation.

THE WAY FORWARD:

  • Consensus and consultation: The Centre must address grievances of farmers through talks. According to the Union Agriculture Minister, there are some issues on which consensus has been reached. However, some issues need a permanent resolution and there should be a committee to address them.
  • Revamping of public support: There is a need for revamping of the public support for farming, which is essential for national food security. This can be achieved better through wide political consultation and by encouraging the beneficiaries of the current system to diversify production and increasing productivity.
  • Creation of Agriculture infrastructure: The government should make efforts to enable farmer participation in the market by creating modern world-class agriculture infrastructure like Cold Storage facilities.
  • Crop diversification: There is a need for mapping of existing cropping patterns of agro-ecological zones of producer and consumer states. Strategy for diversification policy needs to change the cropping pattern according to the changing needs of the country.

THE CONCLUSION:

Though, the MSP-based procurement by the Food Corporation of India has been the bedrock of food security but there is an urgent need for its reform as the farm sector needs a new model of public support. It cannot be left to the mercy of the market. The government should lead the efforts to create a national consensus on this question.

UPSC PREVIOUS YEAR QUESTION

Q.1 The Minimum Support Price (MSP) scheme protects farmers from the price fluctuations and market imperfections. In the light of the given statement, critically analyse the efficacy of the MSP. (2020)

MAINS PRACTICE QUESTION

Q.1 Discuss the role of Minimum Support Price (MSP) in addressing the issue of farmers’ income and agricultural productivity. Suggest alternative ways to ensure farmers income and their livelihoods.
SOURCE: https://www.thehindu.com/opinion/editorial/farming-consensus-on-the-government-and-the-farmers-on-protest/article67846219.ece


PRUDENCE PREVAILS: ON KEEPING MONETARY POLICY DISINFLATIONARY

THE CONTEXT: The Reserve Bank of India’s Monetary Policy Committee (MPC) decided to keep the repo rate unchanged at 6.5% for the sixth consecutive meeting. The MPC’s decision is influenced by uncertainties in food prices, which continue to affect the headline inflation trajectory. The recent trends in retail inflation and the potential impact of food price gains on inflation expectations are also highlighted.

ISSUES:

  • Monetary Policy and Inflation Control: The RBI’s Monetary Policy Committee has kept the repo rate unchanged at 6.5% for the sixth consecutive meeting. The committee is committed to maintaining a monetary policy to reduce inflation and stabilize prices.
  • Food Prices and Inflation: Food prices greatly impact inflation. In December, retail inflation was 5.69% due to uncertainties. The Consumer Food Price Index rose 9.53%, much higher than October’s 6.61%.
  • Inflation Projections and Policy Response: The MPC has predicted that retail inflation in the first quarter of the year will be around 5%. To meet the target of 4%, policymakers must keep up their efforts to control price increases.
  • Economic Growth and Consumption: Despite inflation, the economy remains strong. However, high inflation could negatively impact growth by reducing consumption.
  • Food Prices as Core of India’s Inflation: Food prices can sometimes increase in a way that affects inflation similarly to other basic goods. This can lead to people expecting more price increases, undermining the goal of stabilizing prices.

THE WAY FORWARD:

  • Monetary Policy Measures: The Reserve Bank of India (RBI) can employ various monetary policy tools to control inflation. These include adjusting the Repo Rate, Reverse Repo Rate, and Bank Rate and employing Open Market Operations, Statutory Liquidity Ratio (SLR), Cash Reserve Ratio (CRR), and Liquidity Adjustment Facility (LAF). However, it’s important to note that while these measures can help manage inflation, they are not a complete solution and have limitations.
  • Investment in Infrastructure: Road infrastructure can foster efficient and stable food markets, which can help stabilize food prices.
  • Crop Diversification: Diversifying the types of crops grown can help stabilize the yield of the crops in the system, which can help control food prices.
  • Improving Supply Chain Management: Short-term food inflation is often caused by limited yield or poor supply chain management. Therefore, improving supply chain management can help control food inflation.
  • Providing Targeted and Flexible Food Safety Nets: This can ensure access to healthy diets and national food security, particularly for the most vulnerable groups.
  • Addressing Long-Term Threats to Food Production: These include water scarcity, soil degradation, the environmental impacts of climate change, and competition for productive land due to urban expansion.
  • Regulating Biofuels: Biofuels add stress to the weak supply and demand equilibrium of world food market commodities, so regulating them could help reduce food price volatility.
  • Strengthening the Supply Side: It is necessary to strengthen the supply side rather than concentrate only on the demand side. The RBI can lay certain regulations to direct funds for improvement in supply.

THE CONCLUSION:

The MPC’s decision reflects its commitment to ensuring that inflation aligns with the target of 4%, particularly in the face of volatile food prices. However, the article suggests that policymakers must remain steadfast in their resolve to slow price gains towards the target or risk dampening consumption and undermining growth momentum. There is a need for a balanced approach to manage inflation while supporting economic growth.

UPSC PAST YEAR QUESTION:

Q. Do you agree that steady GDP growth and low inflation have left the Indian economy in good shape? Give reasons in support of your arguments. (2019)

MAINS PRACTICE QUESTION:

Q. Discuss the impact of keeping the repo rate unchanged on the various sectors of the economy, considering the current inflationary trends and the need for economic growth.

SOURCE:

https://www.thehindu.com/opinion/editorial/prudence-prevails-on-keeping-monetary-policy-disinflationary/article67828996.ece


INDIA’S WORRYING TAKE ON GROWTH

THE CONTEXT: The difference between India’s projected GDP growth and the slower growth rates in private final consumption, especially in the rural sector, is a cause for concern. The growth of rural wages not keeping pace with inflation and high demand for MGNREGA work suggests that the economy is still recovering from the pandemic’s impact despite the projected GDP growth figures.

ISSUES:

  • Consumption and Income Disparities: Discrepancy between GDP growth and individual consumption reflects growing income disparities, with the brunt being borne by rural and lower to middle-income households.
  • Rural Economic Fragility: Sales trends in FMCG and agricultural sectors, such as the decline in tractor sales, denote a weaker rural demand, hinting at deep-seated economic vulnerabilities.
  • Inflationary Pressures: The nominal wage growth in rural areas is not adjusted for inflation, which could mean the real income growth is stagnant or negative.
  • High Demand for MGNREGA: Despite purported economic recovery, the continued reliance on MGNREGA for employment indicates structural job market issues and persistent unmet demand for employment.
  • Welfare versus Wage Growth: While government welfare schemes have successfully reduced multidimensional poverty, they are not a substitute for organic income growth through employment, ultimately driving sustainable consumption and economic growth.

THE WAY FORWARD:

  • Job Creation Initiatives: Promote policies that incentivize employment creation, especially in the private sector, including infrastructure development and support for entrepreneurship in rural areas.
  • Managing Inflation: Ensure monetary and fiscal policies are attuned to manage inflation so that nominal wage increases translate to real income growth.
  • Encouraging Private Investment: Implement reforms that boost investor confidence and attract investments in key sectors that can lead to job-rich growth.
  • Rural Income Enhancement: Increase the real income of rural workers by augmenting initiatives like MGNREGA and promoting rural industrialization to create jobs outside the agricultural sector.
  • Targeted Support for Agriculture: Offer more support to the agricultural sector through investment in technology and infrastructure, enabling better productivity and higher revenue potential.
  • Comprehensive Job Creation: Foster an environment conducive to investment, which could lead to more robust job creation, particularly in industries with the potential to employ large labor forces and add value to the economy.
  • Focus on Skill Development: Implement larger-scale skill development programs for urban and rural populations to prepare the workforce for current and future market demands.

THE CONCLUSION:

To ensure that the growth is sustainable and inclusive, there is an imperative to create employment opportunities that spur income growth and reduce inequality. This will lay the foundation for a cycle of positive economic outcomes where increased consumption demands are met by increased production and investments, leading to persistent, broad-based economic development.

UPSC PAST YEAR QUESTION:

Q.1) Do you agree with the view that steady GDP growth and low inflation have left the Indian economy in good shape? Give reasons in support of your arguments. (2019)

Q.2) It is argued that the strategy of inclusive growth is intended to meet the objectives of inclusiveness and sustainability together. Comment on this statement. (2019)

MAINS PRACTICE QUESTION:

Evaluate the implications of the disparity between India’s GDP growth and private final consumption on the economy’s long-term sustainable development and suggest comprehensive policy measures to address the underlying socio-economic challenges.

SOURCE:

https://indianexpress.com/article/opinion/editorials/indias-worrying-take-of-growth-9131963/


DEBUNKING K-SHAPED RECOVERY: WHY THE SBI’S NEW REPORT GETS IT ALL WRONG ABOUT INDIA’S ECONOMIC GROWTH

THE CONTEXT: The Economic Research Department of the State Bank of India (SBI) recently published its study Debunking K-shaped recovery.

MORE ON THE NEWS:

  • It is being widely debated that the post-pandemic recovery in India has been K-shaped. The debate over K-shaped recovery is also linked to widening inequality in the country.
  • However, SBI research study claims to have “debunked” this belief. The report highlighted at a “conspiracy” against India and its growth.

WHAT IS K-SHAPED RECOVERY?

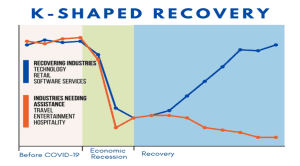
  • A K-shaped recovery occurs when, following a recession, different parts of the economy recover at different rates, times, or magnitudes. It refers to a situation where some sectors of the economy revive after slowdown or recession while others don’t. It means not all sectors/parts of the economy are recovering.
  • This is in contrast to an even, uniform recovery across sectors, industries, or groups of people.
  • A K-shaped recovery leads to changes in the structure of the economy or the broader society as economic outcomes and relations are fundamentally changed before and after the recession.
  • This type of recovery is called K-shaped because the path of different parts of the economy when charted together may diverge, resembling the two arms of the Roman letter “K.”

SBI REPORT’S ARGUMENTS

  • Positive Emerging Patterns: It highlights patterns of income, savings, consumption, expenditure and policy measures aimed at public welfare.
  • Parameters under Scrutiny: The report challenges traditional parameters used to assess economic well-being. It questions the use of old parameters like low two-wheeler sales or fragmented land holdings.
  • New Considerations: It highlights patterns in income, savings, consumption, expenditure, and policy measures designed to empower the masses through technology-driven solutions, questioning the reliance on outdated indicators like 2-wheeler sales or land holdings.
  • Rising Disposable Incomes in Non-Metro Areas: It cites data from Zomato as an example of rising disposable income in non-metro areas.
  • Decrease in Inequality: It refers to the income tax data for FY22 to note that the Gini coefficient had declined significantly from 0.472 to 0.402 between FY14 and FY22.
    It highlights that 36.3% of individual tax return filers belonging to the lowest income in FY14 have left the lowest income group and shifted upwards.

A DIFFERENT PERSPECTIVE

  • Not representative: The research of SBI is not representative of the Indian economy, it also brings out a newly-destined ‘narrative’. It just focuses on the “privileged” formal sector that, going by various estimates, has recorded impressive growth.
  • Contrasting Reports: In 2022, another report, “The State of Inequality in India,” commissioned by the Economic Advisory Council to the Prime Minister, highlighted rising inequality in the country. It noted that an individual earning a monthly wage of Rs 25,000 was among the top 10% of earners, underscoring the stark income disparities.
  • High Welfare Spending indicated Economic distress: The government has been forced to extend the scheme of subsidized food grain to 800 million Indians.
  • Tax Data does not reflect Broader Economy: Only a very small minority of people pay direct income tax. Hence, it is not reasonable to draw conclusions from tax data about broader inequality. Income tax data is nominal and is affected by overall inflation, thus making it unviable for drawing conclusions.

THE WAY FORWARD:

  • Increase government spending: The government must spend where necessary to alleviate the concerns in the most troubled areas of the economy.
  • Addressing debt issues: There is a need for a credible target for the country’s consolidated debt with the setting up of an independent fiscal council to put forward on the quality of the budget would be a great step.
  • Include budgetary resources: Budgetary resources needs to be expanded through asset sales, including parts of government enterprises and surplus government land.
  • Analysing data: The shape of economic recovery is not an exact science, but the predictions help governments, investors, and consumers alike in planning monetary policies and investments.

THE CONCLUSION:

The recent SBI research provides a unique perspective on India’s economic recovery and inequality but its focus on a limited sample from the formal sector raises concerns about its representativeness. There is a need to emphasis on more comprehensive understanding of the diverse economic landscape in India.

UPSC PREVIOUS YEAR QUESTION

Q. Do you agree that the Indian economy has recently experienced V-shaped recovery? Give reasons in support of your answer. (2021)

MAINS PRACTICE QUESTION

Q. ‘Recent SBI report has debunked the theory that India has experienced K-shaped economic recovery in the post-pandemic era’. Examine.

SOURCE:https://www.downtoearth.org.in/blog/economy/debunking-k-shaped-recovery-why-the-sbi-s-new-report-gets-it-all-wrong-about-india-s-economic-growth-94086#:~:text=The%20Economic%20Research%20Department%20of,of%20the%20economy%20are%20recovering.


THE PM-KISAN MODEL: NOT THE WAY FORWARD

THE CONTEXT: The government has set a target of six months to ensure the full saturation of government’s welfare schemes. In this regard, the ruling government is undertaking a “saturation drive” to take the total number of farmer-beneficiaries under the Pradhan Mantri Kisan Samman Nidhi (PM-Kisan) to about 8.75 crore, from the current 8.12 crore or so.

PRADHAN MANTRI KISAN SAMMAN NIDHI

  • It is a Central Sector Scheme to provide income support to all landholding farmers families in the country to supplement their financial needs for procuring various inputs related to agriculture and allied activities.
  • Under the Scheme, the entire financial liability towards transfer of benefit to targeted beneficiaries will be borne by Government of India.
  • It receives allocation of more than 50% of the Department of Agriculture and Farmers Welfare’s budget to the PMKISAN scheme in 2022-23 and 2023-24.
  • Under the PM-KISAN scheme, all landholding farmers’ families shall be provided the financial benefit of Rs.6000 per annum per family payable in three equal installments of Rs.2000 each, every four months.
  • The Ministry of Agriculture and Farmers Welfare is responsible for the effective implementation of the scheme.

Not eligible to get the benefits of the PM-Kisan scheme:

(a) All institutional Landholders

(b) Farmer families in which one or more of its members belong to following categories:-

  • Former and present holders of constitutional posts
  • Former and present ministers/ State Ministers and former/present Members of Lok sabha/ Rajya sabha/ state Legislative Assemblies/ State Legislative councils, former and present mayors of Municipal corporation, former and present Chairpersons of District Panchayats.
  • All serving or retired officers and employees of Central/ State Government ministries /Offices/Departments and its field units Central or State PSEs and Attached offices /Autonomous institutions under Government as well as regular employees of the Local Bodies (Excluding Multi Tasking staff / Class
    lV/Group D employees).
  • All superannuated/retired pensioners Rs.10,000/-or more (Excluding multi Tasking employees) All Persons who paid lncome Tax in last assessment year
  • Professionals like Doctors, Engineers’ Lawyers, Chartered Accountants, and Architects registered with Professional bodies and carrying out profession by undertaking practices.

SIGNIFICANCE OF THE SCHEME:

  • Income Support to farmers:Farmers receive much-needed financial support from the scheme of Rs. 6,000 annual direct income support. It helps them pay for their urgent needs and lessens their reliance on unofficial lending sources.
  • Poverty Alleviation:The program helps to reduce poverty by giving farmers a steady income, especially in rural areas where agriculture is the only source of income.
  • Rural Development:By directly supplying capital to the rural economy, boosting small enterprises, and generating jobs, the PM-Kisan initiative is essential to advancing rural development.
  • Boosting Agricultural Productivity:With improved access to financial resources, farmers can invest in high-quality seeds, fertilizers, and irrigation facilities, leading to increased agricultural productivity and overall crop yield.
  • Equal treatment: The scheme ensures that every eligible landowning farmer in the country gets covered under this flagship scheme. The scheme is a Direct Income Support (DIS) programme. Every farmer is paid equally irrespective of the crops they grow in whatever quantities and sells to whomsoever at any price. The payment does not depend on the inputs used, whether chemical fertilisers and insecticides or organic manure and biological control of pests and diseases.

ISSUES

  • Insufficient reach: PM-KISAN is not reaching all farmer households as intended. There are various issues leading to exclusion of beneficiaries. This scheme is not pro-poor since recipients of PM-KISAN seemed to be farmers who are richer than the general rural population.
  • Operational challenges: There are concerns at operational level with issues in land record reconciliation, digitization of land records, costs incurred in consolidation of land records. There are various challenges in identifying beneficiaries due to inadequate digitalization of land records.
  • Inadequate transfers: The scheme does not provide a clear design of transfers and a framework for effective grievance redress. Also, market volatility tends to lower the effect of the cash transferred to families which has been insufficient to purchase products as the market price increased substantially.
  • Issues in beneficiaries: PM KISAN tends to distribute cash transfer equally to both large and middle farmer which is not appropriate as needs are different. Also, PM-KISAN covers small and marginal farmers, landless agricultural labourers and tenant farmers are left in the lurch.

THE WAY FORWARD:

  • Identification and Inclusion:It is still difficult to make sure that all farmers who are eligible for the program are found and enrolled. It is imperative to endeavor towards optimizing the beneficiary identification procedure and resolving any concerns pertaining to coverage gaps.
  • Strengthening Last-Mile Delivery:To optimize the benefits of the PM-Kisan, funding must be disbursed to farmers in a timely and effective manner. There is a need to improve the delivery methods by coordinating with stakeholders and using technology to speed up the transfer of payments.
  • Refinement of the scheme: There is a need for refinement of the scheme within this overall framework of the scheme. For instance, Direct Income Support can be given on a per-acre, rather than per-farmer, basis. For example, The Telangana government’s Rythu Bandhu scheme provides farmers up to Rs 12,000 per acre per year. Those farming larger holdings or growing more crops also incur higher expenditures. Such farmers, who are probably more dependent on income from agriculture than marginal holders, deserve extra support.
  • Address the price fluctuation: Due to the volatile market and price fluctuations in different regions, it is important to index the cash transfers to local inflation.

THE CONCLUSION:

Pradhan Mantri Kisan Samman Nidhi (PM-Kisan) scheme is a transformative initiative aimed at providing direct income support to small and marginal farmers across the nation. There is a need of regular monitoring and evaluation of the scheme’s implementation to assess its effectiveness and identify areas for improvement.

PREVIOUS YEAR QUESTIONS

Q.1 The right to fair compensation and transparency land acquisition, rehabilitation and resettlement act, 2013 has come into effect from 1 January 2014. What implication would it have on industrialization and agriculture in India? (2014)

Q.2 Pradhan Mantri Jan Dhan Yojana (PMJDY) is necessary for bringing the unbanked to the institutional finance fold. Do you agree with this for financial inclusion of the poor section of the Indian society? Give arguments to justify your opinion. (2016)

MAINS PRACTICE QUESTION

Q.1 The Pradhan Mantri Kisan Samman Nidhi (PM-Kisan) aims to ensure direct financial support to farmers to improve agricultural activities and overall livelihood. Examine.

SOURCE: https://indianexpress.com/article/opinion/editorials/express-view-on-the-pm-kisan-model-not-the-way-forward-9088031/


INDIA’S JOBS CRISIS, THE MACROECONOMIC REASONS

THE CONTEXT: There are many indications everywhere that India continues to be going through a job crisis. Both official data sources as well as many on-the-ground reports point to this fact.

Two types of employment that prevail in an economy such as India.

1. Wage employment: It is a result of labour demanded by employers in their pursuit of profits.

2. Self-employment: Here labour supply and labour demand are identical, i.e., the worker employs herself.

A further useful distinction can also be made between wage labour and jobs.

1. Wage labour: It includes all forms of labour done for an employer including daily wage work at one extreme and highly paid corporate jobs at the other.

2. Jobs generally refer to relatively better paid regular wage or salaried employment. In other words, all jobs are wage labour, but all wage labour cannot be called jobs.

The labour demand in the formal non-agricultural sector is determined by two distinct factors:

1. Demand for output: Firms in the formal sector hire workers to produce output for profit, labour demand depends on the amount of output that firms are able to sell. Under any given level of technological development, labour demand in the formal sector rises when demand for output rises.

2. State of technology: Labour demand depends on the state of technology that dictates the number of workers that firms need to hire to produce one unit of output. Introduction of labour-saving technologies enables firms to produce the same amount of output by hiring a lower number of workers.

Employment growth rate is determined by the relative strength of two factors:

1. Output growth rate: Policies that promote higher economic growth would also achieve higher employment growth.

2. Labour productivity growth rate i.e growth rate of output per worker: If labour productivity growth rate rises, employment growth rate falls for a given output growth rate. If labour productivity growth rate does not change, higher output growth rate increases employment growth rate.

Macroeconomic policy framework

  • Keynesian theory: It highlight the role of aggregate demand as the binding constraint on employment. Fiscal policy was perceived to increase labour demand by stimulating output. The developing countries that inherited a dual economy structure during their independence, confronted additional constraints on output.
  • Mahalanobis strategy: It identified the availability of capital goods as the binding constraint on output and employment, putting forward the policy for heavy industrialisation.
  • The structuralist theories based on the experiences of developing countries highlighted the possibility of agrarian constraint and the balance of payment constraints.
  • Both these constraints led to key policy debates in India, particularly during the decade of the 1970s and early 1990s.
  • Nonetheless, what remained common to all these different frameworks was the presumption that increasing the output growth rate in the non-agricultural sector would be a sufficient condition for increasing the employment growth rate in the formal sector.

Reasons for this crisis:

  • Low labour demand: There is inadequate labour demand particularly for regular wage work.
  • Disguised employment: The Indian economy has historically been characterised by the presence of both open unemployment and disguised employment. It means high level of informal employment consisting of the self-employed as well as casual wage workers. It also indicates a lack of adequate employment opportunities in the formal sector. This lack of opportunities is reflected by a more or less stagnant employment growth rate of salaried workers in the non-agricultural sector in the last four decades.
  • Jobless growth: In India, the employment growth rate of the formal and non-agricultural sector remained unresponsive despite a significant rise in the GDP growth rate and the value added growth rate during the 2000s as compared to the decade of the 1980s and 1990s. The lack of responsiveness of employment growth rate to changes in output growth rate reflects a phenomenon of jobless growth.

Two types of jobless growth regimes based on the connection between output growth and labour productivity growth.

1. Responsiveness of labour productivity growth rate to output growth rate is weak: The possibility of jobless growth in this case emerges exclusively on account of automation and the introduction of labour-saving technology. But employment growth rate in such regimes would necessarily increase if output growth rate happens to increase. Here, the solution to the jobs crisis is just more rapid economic growth.

2. Responsiveness of labour productivity growth rate to output growth rate is high: This is the case in Inda. Here, the positive effect of output growth rate on employment fails to counteract the adverse effect of labour-saving technologies. Employment growth rate in such regimes cannot be increased simply by increasing GDP growth rate.

THE WAY FORWARD:

  • Both demand and supply side reforms: Such employment policies will need both demand side and supply side components. At the same time, direct public job creation will be needed.
  • Bridging the skill gaps: There is a need for adequate skilled labour and increasing the quality of the workforce through better public provisioning of education and health care.
  • Reorienting macroeconomic framework: Financing expenditures while maintaining debt-stability requires the reorienting of the current macroeconomic framework in a significant way. It can include increasing the direct tax to GDP ratio by reducing exemptions and improving compliance.

THE CONCLUSION:

With the given scenarios, the employment challenge can no longer be met only through more rapid GDP growth. There is a need for separate policy focus on employment.

UPSC PREVIOUS YEAR QUESTIONS

Q) Faster economic growth requires increased share of the manufacturing sector in GDP, particularly of MSMEs. Comment on the present policies of the Government in this regard. (2023)

Q) Is inclusive growth possible under market economy? State the significance of financial inclusion in achieving economic growth in India. (2022)

MAINS PRACTICE QUESTIONS

India is witnessing jobless growth in current times. In this respect, analyse India’s recent economic performance and its impact on job creation.

Source: https://www.thehindu.com/opinion/lead/indias-jobs-crisis-the-macroeconomic-reasons/article67671927.ece


ACCELERATION FORETOLD: ON VOLATILE FOOD PRICES

THE CONTEXT: There is resurgence in headline retail inflation in November which was totally unexpected after the RBI just predicted a  small increase. It is a stark reminder of the risks volatile food prices pose.

INFLATION TREND ANALYSIS

  • National Statistical Office’s provisional reading of headline inflation shows the Consumer Price Index rose by 5.55% year-on-year to a three-month high, from October’s 4.87%.
  • Food price gains measured by the Consumer Food Price Index accelerated by a steep 209 basis points to 8.7% last month. Cereals and vegetables surged 10.3% and 17.7% inflation, respectively.
  • Vegetable price’s rate surging by almost 15 percentage points from October’s 2.8%. Only potato prices, which continued to remain in deflationary territory, offered some respite.
  • Pulses and sugar are other areas of concern, with the first witnessing more than 20% inflation and the sweetener also experiencing an uptick in the pace of price gains to 6.55%.
  • With the RBI having opted to refrain from raising rates for now, the onus lies on the government to help temper inflation.

ABOUT INFLATION:

  • Inflation is defined by the International Monetary Fund as the rate of increase in prices over a given period, encompassing a broad measure of overall price increase or for specific goods and services.
  • It reflects the rising cost of living and indicates how much more expensive a set of goods or services has become over a specified period, usually a year.

Headline Inflation

  • Headline inflation is the raw inflation figure reported through the Consumer Price Index (CPI) that is released monthly by the Bureau of Labor Statistics.
  • Headline inflation is not adjusted to remove highly volatile figures, including those that can shift regardless of economic conditions.

Core Inflation

  • Core inflation is the change in the costs of goods and services but does not include those from the food and energy sectors.
  • It is most often calculated using the consumer price index (CPI), which is a measure of prices for goods and services.

CAUSES OF INFLATION:

  • Supply Shocks: Inflation is caused due to sudden and unexpected disruption to the supply of goods and services. Some of the reasons for reduction in supply are Natural disasters, geopolitical events, or other unforeseen circumstances.
  • Demand-Pull Inflation: It occurs when the demand for goods and services exceeds their supply. When the overall demand in the economy is high, consumers are willing to pay more for the available goods and services that leads to a general rise in prices.
  • Cost-Push Inflation: It is driven by an increase in the production costs for goods and services. This can be caused by factors such as increased incomes, increased costs of raw materials, or disruptions in the supply chain.
  • Increase in the money supply in an economy: When there is more money in circulation, consumers have more purchasing power, which can drive up demand and prices.

CONCERNS RELATED TO INFLATION:

  • Decreased Purchasing Power: Inflation erodes the purchasing power of money, meaning that with the same amount of money, individuals can buy fewer goods and services.
  • Uncertainty and Planning Challenges: High inflation can create uncertainty in the economy. It becomes challenging to plan for the future when prices are constantly changing. Long- planning term becomes difficult, and uncertainty can lead to hesitancy in making investment decisions. This forces the government to spur the investments and leads to crowding-out effects.
  • Reduces overall demand: The eventual fallout of reduced purchasing power is that consumers demand fewer goods and services.
  • Worsens the exchange rate: High inflation means the rupee is losing its power. Investors will take away their capital because of reduced returns. Thus, high inflation can lead to worsening of exchange rate.

THE WAY FORWARD:

  • Monetary Policy: The Reserve Bank of India (RBI), India’s central bank, plays a crucial role in controlling inflation through monetary policy. The RBI adjusts key interest rates, such as the repo rate, to influence money supply and credit in the economy. These monetary measures can help in tackling inflation.
  • Fiscal Policy Measures: The government uses fiscal policies like taxation and public spending to manage inflation. Appropriate fiscal measures can help in curbing demand and controlling inflationary pressures. Higher taxes can reduce disposable income, curbing spending and inflation.
  • Food Price Management: Given that food prices often contribute significantly to inflation in India, the government needs to implement initiatives to manage food supplies and prices. For examples, there is need to strengthening Minimum Support Price (MSP) and the Public Distribution System (PDS). To prevent artificial scarcity and price manipulation, the government need to conduct regular checks  against hoarding and black marketing.

THE CONCLUSION:

There is a need to address the high commodity prices and shortages of raw materials to support the consumption in the country by preserving macro-financial stability.

PREVIOUS YEAR QUESTIONS

Q.1 Do you agree with the view that steady GDP growth and low inflation have left the Indian economy in good shape? Give reasons in support of your arguments.(2019)

Q.2 It is argued that the strategy of inclusive growth is intended to meet the objectives of inclusiveness and sustainability together. Comment on this statement.(2019)

MAINS PRACTICE QUESTION

Q.1 How does inflation affect the consumption and economic growth in the country?. Suggest measures to tackle high inflation in India.

SOURCE: https://www.thehindu.com/opinion/editorial/acceleration-foretold-on-volatile-food-prices/article67642176.ece


MULTIDIMENSIONAL POVERTY INDEX REDUCTION UNDER THE NDA IS FLAWED

THE CONTEXT: The NITI Aayog released the ‘National Multidimensional Poverty Index: A Progress Review 2023’. However, the Union government’s claim that there is a significant decline in poverty in recent years based on Multidimensional Poverty Index (MPI) is being questioned.

MULTIDIMENSIONAL POVERTY INDEX (MPI)

  • NITI Aayog is the nodal agency for the National MPI which ranks States and UTs based on their performance. It has been responsible for constructing an indigenised index for monitoring the performance of States and Union Territories (UTs) in addressing multidimensional poverty.
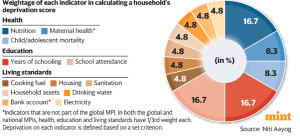
  • It captures overlapping deprivations in health, education and living standards to ascertain multidimensional poverty.
  • Each of the specific parameters under 3 broad categories is assigned a value to calculate what is called a ‘deprivation score’. The deprivation score is the sum of the weighted status of all the indicators for an individual  if it is more than 0.33, only then an individual is considered multidimensionally poor.

FINDING OF MPI, 2023:

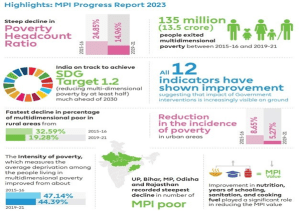
  • India has achieved a remarkable reduction in its MPI value and Headcount Ratio between 2015-16 and 2019-21. Uttar Pradesh (UP), Bihar, Madhya Pradesh (MP), Odisha and Rajasthan recorded steepest decline in number of MPI
  • Improvement in nutrition, years of schooling, sanitation, and cooking fuel played a significant role in reducing the MPI
  • The MPI estimates highlight a near-halving of India’s national MPI value and decline in the proportion of population in multidimensional poverty from 24.85% to 14.96% between 2015-16 and 2019-21.
  • This reduction of 9.89 % in multidimensional poverty indicates that, at the level of projected population in 2021, about 135.5 million persons have escaped poverty between 2015-16 and 2019-21.
  • Besides, the intensity of poverty, which measures the average deprivation among the people living in multidimensional poverty, reduced from 47.14% to 44.39%.

ISSUES IN MPI:

  • Similar issues as UNDP’ HDI: United Nations Development Programme (UNDP) constructed an overall measure of human development with uniform weights of the three components. Following this methodology, NITI Aayog and the UNDP released recently a National Multidimensional Poverty Index/MPI: A Progress Review 2023. Hence, these reports suffer from the same flaws as the UNDP human development index aggregation with uniform weighting.
  • Reliability on authenticity of data: The government had failed to provide access to authentic and unimpeachable data on many indicators. Rise in income alone cannot measure other dimensions of poverty such as access to healthcare, sanitation and transport. While the MPI should be seen in addition to data on income-level, the government was silent on income data. MPI relies upon National Family Health Survey (NFHS) 4 and NFHS 5, which are not detailed enough for its estimation. The government had not released a consumption expenditure survey conducted by the National Survey Organisation (NSO) in 2017-18. The NSO has announced consumption expenditure surveys for 2022-23 and 2023-24.
  • Did not take into account pandemic situation: As a consequence of this pandemic, there was a huge economic shock from which the Indian economy has been struggling to recover. To illustrate, GDP growth has declined from 8% in 2015-16 to 3.78 % in 2019-20 and slumped -6.60 in 2020-21, as also per capita income. Country’s economy had not even gone back to the pre-pandemic level, this raises question of how such a large number of people had escaped poverty.

THE WAY FORWARD:

  • Quality of data: There is a need to enhance the quality and availability of data on multidimensional poverty at more frequent intervals. It can be done by integrating the MPI into planning, budgeting, implementation and evaluation processes at all levels of government.
  • Rigorous Analysis: There is a need of in-depth analysis of the parameters of multidimensional poverty at the national, State/UT, and district levels. It will help in development of the National MPI to act as public policy tool which monitors multidimensional poverty, informs evidence-based and focused interventions.
  • Collaboration and coordination: There is a need to strengthen the coordination and convergence among different ministries, departments, agencies and stakeholders involved in addressing multidimensional poverty.
  • Increase in investment: Government should focus on investments in critical areas as education, nutrition among others to eradicate poverty. It can be done through targeted policies, schemes, and developmental programmes rolled out at both the national and sub-national levels.
  • Awareness: There is a need to increase the awareness and participation of civil society, media, academia and other actors in advocating for and monitoring multidimensional poverty reduction.

THE CONCLUSION:

Recently released MPI index have several lacunae which need reinterpretation to eradicate poverty with proper policy interventions. Consistent policy implementation across a diverse set of programmes and initiatives that have strong interlinkages will lead to a further reduction in deprivations across multiple indicators.

PREVIOUS YEAR QUESTION

Q.1 Though there have been several different estimates of poverty in India, all indicate a reduction in poverty levels over time. Do you agree? Critically examine with reference to urban and rural poverty indicators. (2015)

MAINS PRACTICE QUESTIONS

Q.1 Poverty impacts the social, economic and environmental aspects of the nation differently. Suggest the possible ways to eradicate poverty and achieve sustainable development goals in India.

Q.2 Recent assessment of poverty by Multidimensional Poverty Index (MPI) has been termed as flawed as the government estimates fail to paint an accurate picture of the realities. Critically analyse this statement.

SOURCE: https://www.thehindu.com/opinion/op-ed/multidimensional-poverty-index-reduction-under-the-nda-is-flawed/article67611818.ece#:~:text=Astonishingly%2C%20the%20MPI%202023%20estimates,%2D16%20and%202019%2D21.