PRICING OF ESSENTIAL DRUGS IN INDIA

THE CONTEXT: Recently in March 2022, the concerns have been raised that consumers may have to pay more for medicines and medical devices if the National Pharmaceutical Pricing Authority (NPPA) allows a price hike of over 10% in the drugs and devices listed under the National List of Essential Medicines (NLEM). The following article explains everything about the pricing of essential drugs in India.

WORKING OF PRICING MECHANISM

  • All medicines under the NLEM are under price regulation. The NLEM lists drugs used to treat fever, infection, heart disease, hypertension, anemia, etc, and includes commonly used medicines like paracetamol, azithromycin, Cardiac Stents, Knee implants, etc.
  • The Health Ministry prepares a list of drugs eligible for price regulation, following which the Department of Pharmaceuticals incorporates them into Schedule 1 of DPCO.
  • The Standing Committee on Affordable Medicines and Health Products (SCAMHP) will advise the drug price regulator the National Pharmaceutical Pricing Authority (NPPA) on vetting the list. The NPPA then fixes the prices of drugs in this Schedule.
  • As per the Drugs (Prices) Control Order 2013, scheduled drugs, about 15% of the pharma market, are allowed an increase by the government as per the WPI (Wholesale Price Index) while the rest 85% are allowed an automatic increase of 10% every year.
  • The annual change in prices of scheduled drugs is controlled and rarely crosses 5%.
  • Under the Drugs and Cosmetics Act 1940, the drugs are classified in schedules, and regulations are laid down for their storage, display, sale, dispensing, leveling, prescribing, etc.

Essential Medicines List:

  • As per the World Health Organisation (WHO), Essential Medicines are those that satisfy the priority health care needs of the population. The list is made with consideration of disease prevalence, efficacy, safety, and comparative cost-effectiveness of the medicines.
  • Such medicines are intended to be available in adequate amounts, inappropriate dosage forms, and strengths with assured quality. They should be available in such a way that an individual or community can afford them.

National List of Essential Medicines of India:

  • The WHO EML is a model list, the decision about which medicines are essential and remains a national responsibility based on the country’s disease burden, priority health concerns, affordability concerns, etc.
  • Ministry of Health and Family Welfare, Government of India hence prepared and released the first National List of Essential Medicines of India in 1996 consisting of 279 medicines. This list was subsequently revised in 2003, 2011, and 2021.

ABOUT THE NATIONAL PHARMACEUTICAL PRICING AUTHORITY

The National Pharmaceutical Pricing Authority (NPPA) is a government regulatory agency that controls the prices of pharmaceutical drugs in India. It was constituted by a Government of India Resolution dated 29th August 1997 as an attached office of the Department of Pharmaceuticals (DoP), Ministry of Chemicals and Fertilizers as an independent regulator for pricing of drugs and to ensure availability and accessibility of medicines at affordable prices with Headquarter at New Delhi, India.

Drugs (Prices) Control Order 2013:

  • The Drugs Prices Control Order is an order issued by the Government of India under Sec. 3 of Essential Commodities Act, 1955 to regulate the prices of drugs.
  • The Order provides the list of price-controlled drugs, procedures for fixation of prices of drugs, method of implementation of prices fixed by Govt., penalties for contravention of provisions, etc.
  • For the purpose of implementing provisions of DPCO, powers of Govt. have been vested in NPPA.
  • The DPCO 2013 contains more than 600 scheduled drug formulations spread across 27 therapeutic groups. However, the prices of other drugs can be regulated, if warranted in the public interest.

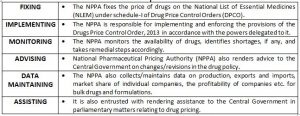
KEY FUNCTIONS OF NPPA

NPPA INITIATIVES

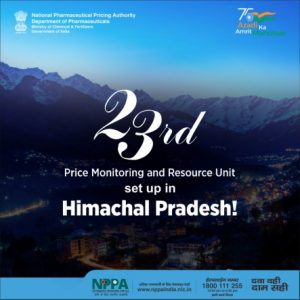
  • The National Pharmaceutical Pricing Authority (NPPA) is headquartered in New Delhi and to increase its reach across the country, NPPA has set up a Price Monitoring and Resource Unit (PMRU) in the various Indian States and Union Territories.
  • These PMRUs have been set up under the Consumer Awareness, Publicity, and Price Monitoring (CAPPM) scheme.
  • As of March 2022, there are 23 states/UTs with the most recent addition of Himachal Pradesh on 23rd March 2022 as the 23rd Price Monitoring and Resource Unit (PMRU). The pharmaceutical authority aims to set up a price monitoring unit in each and every state and union territory across India.

SIGNIFICANCE OF NPPA

  • It is important to fix the prices of certain important drugs so that they are affordable and accessible to every citizen of the county and the National Pharmaceutical Pricing Authority ensures the same.
  • It mandates that no supplier can sell a drug for more than its Maximum Retail Price (MRP).
  • NPPA also played a crucial role during the pandemic time in the country by either fixing or regulating the prices of essential drugs and devices.

 AN ANALYSIS OF THE ISSUE

  • The pharma lobby is asking for at least a 10% increase for scheduled drugs too rather than going by the WPI. Over the past few years, input costs have flared up and one of the reasons being 60%-70% of the country’s medical needs, are dependent on China.
  • NPPA has been receiving applications for upward price revision under para 19 of DPCO, 2013, for the last two years citing reasons like “increase in Active Pharmaceutical Ingredient – API (key ingredient) cost, increase in the cost of production, exchange rates, etc. resulting in unavailability in sustainable production and marketing of the drugs.
  • India is dependent on China for over 60% of its API requirement; higher API costs for price-controlled medicines reduce profits and sometimes even make the production of these drugs unviable in India.

THE WAY FORWARD

  • We all are aware of the shortage of Remdevisir injections in May 2021 and black marketing and hoarding which led to skyrocketing prices. In this context, Bombay HC has asked the Centre to include Remdesivir in the list of Scheduled Drugs and regulate its price. Such steps should be proactively taken by the government with the foresight of emerging situations.
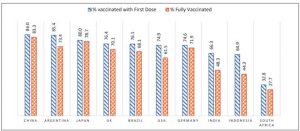
  • The interests of pharmaceutical companies shall not be put ahead of the lives of ordinary citizens. As of 23rd March 2022, only 14% of people in low-income countries have received at least one vaccine dose against COVID-19. India and South Africa have thus, taken a firm position that when lives are at stake, such essential products should be treated as global public goods and IPRs under TRIPS Agreement must be waived.
  • NPPA shall also revise the list of essential medicines at short and regular intervals to have a positive impact on the availability and rational use of medicines.
  • In the longer term, India needs to build capabilities to manufacture the key ingredients for these medicines.

THE CONCLUSION: Having an Essential Medicines List (EML) results in a better quality of medical care, better management of medicines, and cost-effective use of health care resources. This is especially important for a resource-limited country like India. The decision is to ensure, that life-saving essential drugs remain available to the general public at all times. To avoid a situation where drugs become unavailable in the market and the public is forced to switch to costly alternatives this is the first time the NPPA, known to slash prices of essential and life-saving medicines, is increasing prices in the public interest.

MAINS QUESTIONS:

  1. Elaborate on the role of the National Pharmaceutical Pricing Authority (NPPA) in ensuring the availability of life-saving essential drugs to the general public at all times.


KEN-BETWA RIVERS LINK

THE CONTEXT: The Centre constituted the Ken-Betwa Link Project Authority to implement the first initiative under the national river interlinking policy, which seeks to bring nearly 11 lakh hectares of land under irrigation in the parched Bundelkhand region straddling Uttar Pradesh and Madhya Pradesh. Earlier, the finance minister allocated Rs 44,605 crore for the implementation of the Ken-Betwa River link project for irrigation of the Bundle Khand region in the Union Budget 2022-23.

KEN BETWA LINK PROJECT: OVERVIEW

  • It is a river-interlinking project that aims to transfer surplus water from the Ken river in Madhya Pradesh to Betwa in Uttar Pradesh to irrigate the drought-prone Bundelkhand region. Both Ken and Betwa are the tributaries of the Yamuna.
  • It is the first river interlinking project, among the 16 similar projects planned under the Peninsular Rivers Development of the National Perspective Plan (NPP).
  • The main objective of the NPP is the transfer of water from river basins with surplus water to those with scarce water, for tackling the problem of water scarcity. The NPP comprises the Himalayan Rivers Development and Peninsular Rivers Development.
  • The Ken Betwa River linking project, the construction schedule for which has been planned for eight years, will be executed in two phases:
  • Phase-I: In the first phase, the Daudhan dam complex and its appurtenances, such as low-level tunnel, high-level tunnel, 221-kilometre Ken-Betwa link canal, and powerhouses will be completed.
  • Phase-II: In the second phase, the Ken Betwa link project development works will be started for the lower Orr dam, Bina complex project, and Kotha barrage.

KEN BETWA RIVER LINKING PROJECT TIMELINE

  • August 1980: The National Perspective Plan(NPP) is formulated.
  • August 2005: MoU signed by state governments of MP, UP, and the ce
  • central government to prepare the DPR for the project.
  • April 2010: The National Water Development Agency (NWDA) completes the DPR for phase-I of the KBLP.
  • January 2014: The NWDA completes the DPR for phase II of the project.
  • September 2014: Special Committee on interlinking of rivers (ILR) was constituted, for implementing the ILR program.
  • April 2015: A task force for interlinking of rivers was constituted by MoWR, River Development, and Ganga Rejuvenation.
  • March 2021: Governments of UP and MP sign an MoU with the Jal Shakti Ministry for implementing the Ken betwa river linking project.
  • February 2022: Government announces budget allocation of Rs 44,605 crore for the project during the Union Budget 2022-23.

KEN BETWA PROJECT COST

  • The project will be completed at an estimated cost of around Rs 44,605 crores. The Ken-Betwa Link Project Authority, a special purpose vehicle (SPV) for implementing the project will be formed and the central government will bear 90% of the total project cost, while the states will bear the rest (UP and MP).

A Special Purpose Vehicle (SPV) for the project:

  • A Special Purpose Vehicle (SPV) called Ken-Betwa Link Project Authority (KBLPA) will be set up to implement the project. In fact, the Centre has set in motion the process of creation of the National Interlinking of Rivers Authority (NIRA), an independent, autonomous body for planning, investigation, financing, and implementation of the interlinking of river (ILR) projects in the country.
  • The NIRA will have powers to set up SPV for individual link projects.

KEN BETWA RIVER LINKING PROJECT: BENEFITS AND IMPACT

  • The government envisions the interlinking of rivers as a top priority towards sustainable development of water resources in India. The Ken Betwa link project has been planned as a multi-purpose project for providing several benefits in terms of better utilisation of water resources and addressing the water scarcity in several parts of the Bundelkhand region.
  • The region is prone to recurring drought conditions that have impacted socio-economic development in the area. Moreover, the location is not rich in groundwater due to the hard rock and marginal alluvium terrain. Hence, the project will help in utilising the floodwater during monsoon and stabilise the availability of water during lean months, especially in drought years.
  • The Ken and Betwa river project will also provide annual irrigation and hydropower generation. The districts that will benefit from the Ken Betwa link pariyojna include Chhatarpur, Tikamgarh, Sagar, Damoh, Datia, Vidisha, Shivpuri, and Raisen and Panna in Madhya Pradesh and Jhansi, Mahoba, Banda and Lalitpur in Uttar Pradesh. Due to the project, as many as 62 lakh people in the Bundelkhand region will also experience an improved drinking water supply.

SOCIAL, ECONOMIC, AND ENVIRONMENTAL IMPACTS OF THE PROJECT

Social Impact: A major goal of the project is to provide irrigation to the water-scarce Bundelkhand region. According to the Water Resources Ministry, a total of 10 villages consisting of 1,585 families are likely to be affected by this project.

  • Loss of Land: In all 6422.62 ha of private lands would be lost by the project affected families for the construction of the Daudhan dam and other project components along with the canal network under the project. Besides, as per the project design, about 5339.00 ha of forest lands would also be brought under various project components. This indicates that the landowners would lose their landed properties.
  • Loss of Livelihood: About 72 percent of households would become landless, nearly 21 percent would become marginal farmers and almost 7 percent will fall under the small farmer category. As a result of land acquisition, the project affected big farmers who would lose their big farmer status.
  • Loss of Employment: Due to land acquisition, several families, who become landless, would lose their total self-employment, who otherwise have been engaged in their farming activity.
  • Loss of Income: Project-affected household’s socio-economic environment will affect their family life due to loss of land, livelihood, and employment resulting in reduced family income.

Economic Impact:

  • This project will prove several economic benefits like the development of agro-based industries, and transportation and storage facilities.
  • Increased farm supplies, production, and consumption of fertilizer, pesticide, farm equipment, and employment generation.
  • Economic benefits of irrigation water supply include various benefits on, crop production; recharges groundwater, animal husbandry, farm equipment, and agro-processing.
  • Livestock production, especially milk, is a major part of the agricultural economy in the Bundelkhand region. Under the project, a large water body will be coming up by constructing a dam and will certainly recharge and increase the groundwater levels in the project area. This will help the farming community as well as other water users who depended on groundwater facilities.
  • The project has good potential, particularly because of the close proximity of the Daudhan dam site to Khajurao for recreation and tourism development.
  • Provision for the development of tourist huts, and picnic spots has been made on the periphery of Rangwan reservoir (about 9 km from the Daudhan dam site).
  • The negative part of the KBLP project is crop and livestock production loss due to the submergence of the crop area upstream of the reservoir.

Environmental Impact:

  • This project would submerge an area of 9,000 hectares. Of which 5,258 hectares are forest land (including 4,141 hectares of Panna Tiger Reserve).
  • River diversion would bring drastic changes in the physical and chemical compositions of the sediment load, river morphology, and the shape of the delta formed at the river mouth. All these have serious economic and livelihood implications that are merely ignored by the project.
  • The project may also lead to a loss of two million trees.
  • The land use land cover and vegetation data show that tree density and diversity are comparatively higher in the submerged area.
  • The regeneration pattern also shows that the seedling diversity and richness and sapling density diversity and richness are high in the submerged area.
  • Minimum flow in the Ken River is adequate to dilute the untreated sewage. Hence the impact on the surface water quality is negligible, which will still be reduced by sewage treatment measures.
  • There are valuable timber trees that are going to be submerged.

WILL THE PROJECT AFFECT THE PANNA TIGER RESERVE?

  • Panna Tiger Reserve is one of the country’s important and successful tiger recovery reserves.
  • A species recovery plan was developed to reinforce the tiger population, because of which the tiger population has increased from 0 in 2009 to 54 in 2019.
  • Panna Tiger Reserve was included in the global network of biosphere reserves by the United Nations Educational, Scientific, and Cultural Organisation (UNESCO) in 2020.
  • The UNESCO cited PTR as a critical tiger habitat.
  • The Project will lead to the submergence of a major portion of the core area of the Panna Tiger Reserve in Madhya Pradesh, triggering a major loss of the tiger and its major prey species such as chital and sambar.
  • The project may incur an estimated loss of 58.03 square kilometers (10.07 percent) of critical tiger habitat (CTH) in the reserve.
  • There will be an indirect loss of 105.23 sq km of CTH because of habitat fragmentation and loss of connectivity due to submergence.
  • The total area submerged would be 86.50 sq km, of which 57.21 sq km lies within Panna Tiger Reserve. This will account for 65.50 percent of total submergence.

THE INTERLINKING OF RIVERS

The National Perspective Plan (NPP) presented the development of water resources through the inter-basin transfer and the transfer of water from water surplus basins to water-deficit basins. The interlinking of rivers is a large-scale civil engineering project that aims to effectively manage water resources in India under the NPP.

Positives of interlinking of rivers for multi-dimensional inter-related problems

Droughts: The drought-prone regions like Vidharbha face perennial droughts. The interlinking of seasonal peninsular rivers with their Himalayan counterparts may be a gamechanger for this region’s agriculture and food security prospects.

Floods: Interlinking of rivers will contribute to flood and drought hazard mitigation for India. It will most likely eradicate the flooding problems which recur in the northeast and the north every year. For example, floodwaters of the Kosi river could be diverted to other east-flowing rivers.

Improve the inland navigation:

  • Interlinking of rivers will create a network of navigation channels. Water transport is cheaper, less-polluting compare to road and railways.
  • Further, the interlinking of rivers can ease the pressure on railways and roads also.
  • More importantly, India has the huge untapped potential of inland water transport, which can be a game-changer in the logistics aspect and, thus, overall costs of goods & services.

Negatives of interlinking of rivers for multi-dimensional inter-related problems:

  • Ecological challenges: The ambitious project will divert forest areas and submergence fertile land leading to deforestation and soil- erosion. For example, the Ken-Betwa link projects have reduced 8% of the forest land of Panna National Park. Also, river diversion may bring significant changes in the physical and chemical compositions of the sediment load, river morphology, and the shape of the delta formed in the river basin.
  • Social challenges: Reconstruction and rehabilitation of millions of people in and around the river catchments could face significant psychological damage, resulting in social unrest and protests in the initial stages.
  • Political challenges: India’s inter-state river doesn’t have a bright history (for example, the Cauvery River dispute). Further, water being a state subject demands sustained inter-state cooperation which may be a challenge given the diversity India offers.

THE WAY FORWARD:

  • The interlinking of rivers in India has both pros and cons. Implementing the project in its entirety may be a challenge in present times. Therefore, the government must opt for a decentralized method of implementation instead of a centralized one.
  • Inter-linking projects should receive the nod only after appropriate EIA and environmental clearances.
  • Further, we must look for alternatives for efficient water use in India. For instance, measures like efficient water use in agriculture (per drop more crop), resourceful rainwater harvesting in drought-prone areas, and so on can be looked upon to liberate India from the persistent water stress.
  • Adopt Alternative measures: A case study of Jakhni village of Banda district
  • A 2019 NITI Aayog report mentioned Jakhni village of Banda district in Bundelkhand, one of the most water-scarce regions of India. The area witnessed heavy out-migration in search of water and better livelihood opportunities.
  • However, through rigorous water conservation efforts such as the construction of farm ponds, restoration of water bodies, collection and utilization of greywater, raising of farm bunds, and intensive plantation of trees since 2014, the water situation has improved. Jakhni village, for example, has become a self-sufficient water village.
  • Once a drought-prone village, it now produces nearly 23,000 quintals of basmati rice. The production of other crops has also increased manifold.

THE CONCLUSION: In the era of climate change; river networking is the need of time for development. Successful implementation of the Ken- Betwa link project largely looms upon the timely release of water from the surplus basin to the deficit basin. The problem of providing domestic water supplies in areas away from the rivers will largely remain unsolved. Some of the project’s major criticisms are its socioeconomic viability, environmental impacts, displacement and rehabilitation of affected people, the challenge of resource mobilization, geopolitical constraints, and domestic political dynamics. There is an urgent need to take Socio-environmental concerns related to the link Project so a very detailed hydrological, geological, meteorological, and environmental analysis of the project would be imperative for the benefit of India.


GEOMAGNETIC STORMS

THE CONTEXT: In February 2022, Elon Musk’s Starlink lost dozens of satellites that were caught in a geomagnetic storm a day after they were launched. The loss of over 40 satellites in a single solar event has been described as “unheard of” and “huge”.However, the satellites were designed to burn up on reentry into the Earth’s atmosphere and did not create debris in space. The following article explains the phenomenon of geomagnetic storms from a geographical perspective.

GEOMAGNETIC STORMS

A geomagnetic storm is a major and temporary disturbance of Earth’s magnetosphere. They occur when a surge of the solar wind (charged particles from the sun) interacts with Earth’s magnetic field and generates currents in Earth’s upper atmosphere.

The magnetosphere shields our planet from harmful solar and cosmic particle radiation, Solar Storms occur during the release of magnetic energy associated with sunspots (‘dark’ regions on the Sun that are cooler than the surrounding photosphere – the lowest layer of the solar atmosphere) and can last for a few minutes or hours.

A Solar Storm or a Coronal Mass Ejection (CME) as astronomers call it, is an ejection of highly magnetized particles from the sun. These particles can travel several million km per hour and can take about 13 hours to five days to reach Earth.

Earth is surrounded by an immense magnetic field called the magnetosphere. Generated by powerful, dynamic forces at the center of Earth, our magnetosphere shields us from erosion of our atmosphere by the solar wind, erosion and particle radiation from coronal mass ejections, and cosmic rays from deep space. Our magnetosphere plays the role of gatekeeper, repelling this unwanted energy that’s harmful to life on Earth.

  • The Bow Shockoccurs when the magnetosphere of an astrophysical object interacts with the nearby flowing ambient plasma such as the solar wind. For Earth and other magnetized planets, it is the boundary at which the speed of the stellar wind abruptly drops as a result of its approach to magnetopause.
  • The Polar Cuspsare near-zero magnetic field magnitude and funnel-shaped areas between field lines that map to the dayside and nightside of the magnetopause surface. They are the primary regions for direct entry of magnetosheath/solar wind plasma into the magnetosphere and may create the appearance of beautiful auroras when seen from the arctic regions of the Earth.
  • Van Allen radiation belt, doughnut-shaped zones of highly energetic charged particles trapped at high altitudes in Earth’s magnetic field. The belts are most intense over the Equator and are effectively absent above the poles. The Van Allen radiation belt is a zone of energetic charged particles originating from the solar wind. The particles are captured and held around a planet by that planet’s magnetic field. It surrounds Earth, containing a nearly impenetrable barrier that prevents the fastest, most energetic electrons from reaching Earth.

IMPACT OF GEOMAGNETIC STORMS ON EARTH

ON SPACE WEATHER: Not all solar flares reach Earth, but solar flares/storms, Solar Energetic Particles (SEPs), high-speed solar winds, and Coronal Mass Ejections (CMEs) that come close can impact space weather in near-Earth space and the upper atmosphere.

ON  MAGNETOSPHERE: Coronal Mass Ejections (CMEs) significantly loaded with matter traveling at millions of miles an hour can potentially create disturbances in the magnetosphere. Geomagnetic storms result in intense currents in the magnetosphere, changes in the radiation belts, and changes in the ionosphere, including heating the ionosphere and the thermosphere.

ON SPACE-DEPENDENT SERVICES: Solar storms can hit operations of space-dependent services like Global Positioning Systems (GPS), radio, and satellite communications. Aircraft flights, power grids, and space exploration programs are also vulnerable to geomagnetic storms.

ON COMMUNICATION: Geomagnetic storms interfere with high-frequency radio communications that rely on the ionosphere for propagation.

ON POWER GRIDS, OIL, AND GAS PIPELINES: When the earth is in the direct path of such solar storms, these magnetized and charged solar particles will interact with the earth’s magnetic field and induce strong electric currents on the earth’s surface that can damage long-distance cables.

ON UNDERSEA INTERNET CABLES: Undersea cables have a higher risk of failure compared to land cables due to their large lengths as current is proportional to the area of the loop formed by the two grounds and the cable.

HEALTH RISKS FOR ASTRONAUTS: Astronauts on spacewalks face health risks from possible exposure to solar radiation outside the Earth’s protective atmosphere.

FORMATION OF AURORAS: These storms can create the appearance of beautiful auroras aurora borealis (the northern lights) and aurora australis (the southern lights.)

LINK BETWEEN SOLAR STORMS AND ANIMAL BEACHINGS: Researchers from a cross-section of fields pooled massive data sets to see if disturbances to the magnetic field around Earth could be what confuses these sea creatures, known as cetaceans. CETACEANS are thought to use Earth’s magnetic field to navigate. Since intense solar storms can disturb the magnetic field, scientists want to determine whether they could, by extension, actually interfere with animals’ internal compasses and lead them astray. However solar storms may not be the primary cause of animal beaching but the research continues.

LINK BETWEEN SOLAR STORMS AND MIGRATORY BIRDS: Birds possess a magnetic sense and rely on the Earth’s magnetic field for orientation during migration. However, the geomagnetic field can be altered by solar activity at relatively unpredictable intervals. How birds cope with the temporal geomagnetic variations caused by solar storms during migration is still unclear.

CONCERNS WITH GEOMAGNETIC STORMS

  • The Sun goes through an 11-year cycle – cycles of high and low sunspots activity. It also has a longer 100-year cycle. During the last three decades, when the internet infrastructure was booming, it was a low period. And very soon, either in this cycle or the next cycle, we are going towards the peaks of the 100-year cycle. So it is highly likely that we might see one powerful solar storm during our lifetime
  • The rapid development of technology took place in the last three decades when the Sun was in its period of low activity and there are very limited studies on whether our current infrastructure can withstand a powerful solar storm.

GEOMAGNETIC STORMS AND INDIA

  • The countries in the lower latitudes are at a much lower risk but there is a need for more studies to fully understand the effects of geomagnetic storms and the regions of lower latitudes.
  • Modelled and Simulation Studies to understand how connectivity will be affected on a country-scale, showed that the majority of cables connecting India will be unaffected.
  • Even under the high-failure scenario, some international connectivity remains (e.g., India to Singapore, the Middle East, etc.). Unlike in China, the key cities of Mumbai and Chennai do not lose connectivity even with high failures
  • Compared to the US, India is less vulnerable, but we still need to know more about the strength of solar storms and whether a powerful one can affect India.

THE WAY FORWARD

  • Shutdown Strategy:‘Shutdown Strategy’ can help minimize the connectivity loss during and after a solar storm impact. Similar to how we power off power grids, a temporary internet shutdown can protect our equipment during a solar event and ensure the continuation of services.
  • Systematic Protocols:
  • We need a more systematic protocol for doing this. Both NASA and the European Space Agency have probes now that can detect a solar storm and can give about 13 hours of warning.
  • Experts from different fields need to come together to design protocols for power companies and internet service providers.
  • Also, today’s health care system depends on power and the internet and we need to have a fallback strategy.
  • With the increasing global dependence on satellites for almost every activity, there is a need for better space weather forecasts and more effective ways to protect satellites.

THE CONCLUSION: Current models are capable of predicting a storm’s time of arrival and its speed. But we are still not able to predict the storm’s structure or orientation. Independent solar observations show that solar superstorms capable of large-scale damage may occur only a few times in a century. Nevertheless, given their potential to cause large-scale disruption to our modern society, research and studies are needed to help us prepare and take steps for reducing their impact.

MAINS QUESTIONS:

  1. What are geomagnetic storms? What steps are needed to prepare for any possible cause of a powerful solar storm in the future?
  2. Explain the possible consequences of a powerful solar storm on life and property on Earth.

ADDED INFORMATION: 5 categories measure geomagnetic storms given by National Oceanic and Atmospheric Administration, USA (NOAA).


ECONOMIC IMPACTS OF RUSSIA-UKRAINE WAR

THE CONTEXT: The Russian invasion of Ukraine, which started in February 2021, is the largest conventional military attack seen since World War II and can cause a global economic catastrophe. It has deep implications for the world economy as well as the Indian economy. This article analyses those consequences and suggests the way forward for them.

ECONOMIC IMPACTS ON THE WORLD

ENERGY AND COMMODITIES MARKETS:

  • Russia is the world’s 3rd largest oil producer, the 2nd largest natural gas producer, and among the top 5 producers of steel, nickel, and aluminum. It is also the largest wheat exporter globally (almost 20% of global trade).
  • On its side, Ukraine is a key producer of corn (6th largest), wheat (7th), and sunflowers (1st), and is amongst the top ten producers of sugar beet, barley, soya, and rapeseed.
  • On the day the invasion began, financial markets worldwide fell sharply, and the prices of oil, natural gas, metals, and food commodities surged.
  • Brent oil prices breached USD 130 per barrel following the latest developments, while Europe’s TTF gas prices surged at a record EUR 192 on 4th March.
  • While high commodity prices were one of the risks already identified as potentially disruptive to the recovery, the escalation of the conflict increases the likelihood that commodity prices will remain higher for much longer. In turn, it intensifies the threat of long-lasting high inflation, thereby increasing the risks of stagflation & social unrest in both advanced & emerging countries.

AUTOMOTIVE, TRANSPORT, CHEMICALS ARE THE MOST VULNERABLE SECTORS:

  • The crisis is obviously strongly impacting an already strained automotive sector due to various shortages and high commodity & raw material prices: metals, semiconductors, cobalt, lithium, and magnesium.
  • Ukrainian automotive factories supply major carmakers in Western Europe: some announced the stoppage of factories in Europe while other plants around the world are already planning outages due to chip shortages.
  • Airlines and maritime freight companies will also suffer from higher fuel prices, airlines being the most at risk.
  • First, fuel is estimated to account for about a third of their total costs.
  • Second, European countries, the US and Canada, have forbidden access to their territories to Russian airlines and in turn, Russia has banned European and Canadian aircraft from its airspace.
  • This means higher costs since airlines will have to take longer routes. Eventually, airlines have little room for rising costs as they continue to face lower revenues due to the impact of the pandemic.
  • Rail freight will also be impacted: European companies are forbidden to do business with Russian Railways, which will likely disrupt freight activity between Asia and Europe, transiting through Russia.
  • It is expected that feedstock for petrochemicals will be more expensive, and the soaring prices of natural gas will impact the fertilizer markets, hence the whole agri-food industry.

DEEP RECESSION AHEAD FOR THE RUSSIAN ECONOMY:

  • The Russian economy will be in great difficulty in 2022, falling into a deep recession. Coface’s updated GDP forecast for 2022 stands at -7.5% after the recovery experienced last year. This has led to a downgrade of the country’s risk assessment from B (fairly high) to D (very high).
  • Sanctions notably target major Russian banks, the Russian central bank, the Russian sovereign debt, selected Russian public officials & oligarchs, and the export control of high-tech components to Russia. These measures put considerable downward pressure on the Russian ruble, which has already plummeted and will drive a surge in consumer price inflation.
  • Russia has built up relatively strong financials: a low level of public external debt, a recurrent current account surplus, as well as substantial foreign reserves (app. USD 640 bn). However, the freeze imposed by western depositary countries on the latter prevents the Russian central bank from deploying them and reduces the effectiveness of the Russian response.
  • The Russian economy could benefit from higher prices for commodities, especially for its energy exports.
  • However, EU countries announced their intention to limit their imports from Russia. In the industrial sector, restricted access to Western-produced semiconductors, computers, telecommunications, automation, and information security equipment will be harmful, given the importance of these inputs in the Russian mining and manufacturing sectors.

EUROPEAN ECONOMIES ARE AT A HIGH RISK:

  • Because of its dependence on Russian oil & natural gas, Europe appears to be the region most exposed to the consequences of this conflict. Replacing all Russian natural gas supply to Europe is impossible in the short to medium run and current price levels will have a significant effect on inflation.
  • While Germany, Italy, and some countries in the Central and Eastern European region are more dependent on Russian natural gas, the trade interdependence of Eurozone countries suggests a general slowdown.
  • On top of that, we estimate that a complete cut of Russian natural gas flows to Europe would raise the cost to 4 percentage points in 2022, which would bring annual GDP growth close to zero, more probably in negative territory – depending on demand destruction management.

NO REGION WILL BE SPARED BY IMPORTED INFLATION AND GLOBAL TRADE DISRUPTIONS:

  • In the rest of the world, the economic consequences will be felt mainly through the rise in commodity prices, which will fuel already existing inflationary pressures. As always, when commodity prices soar, net importers of energy & food products will be particularly affected, with the specter of major supply disruptions in the event of an even greater escalation of the conflict. The drop in demand from Europe will also hamper global trade.
  • In Asia-Pacific, the impact will be felt almost immediately through higher import prices, particularly in energy prices. Many economies in the region are net energy importers, led by China, Japan, India, South Korea, Taiwan, and Thailand.
  • As North American trade and financial links with Russia and Ukraine are fairly limited, the impact of the conflict will mainly be felt through the price channel and through the slowdown of European growth.
  • Despite the prospect of slower economic growth and higher inflation, the recent geopolitical events are not expected to derail monetary policy in North America at this stage.

IMPACT ON INDIA

Despite India’s limited direct exposure, the combination of supply disruptions and the ongoing terms of trade shock will likely weigh on growth, resulting in a sharper rise in inflation, and (leading to) a wider current account deficit.

India’s trade with Russia and Ukraine

  • India runs a trade deficit with Russia, with exports declining while imports are increasing. Oil forms a major part of our import basket from Russia.
  • According to the MoF report, 8 percent of our total imports have been imported from Russia in FY22.

Here are the ways India could suffer due to a Russia-Ukraine war even without being part of it.

BAN ON RUSSIA’S CRUDE EXPORTS:

  • In reaction to the US’s ban on all oil and gas imports from Russia, Brent crude prices surged to nearly $130 per barrel in the first week of March 2022.
  • This is a major setback for global economic growth as Russia is one of the largest exporters of crude oil globally. India’s trade, however, comprises only 1% of oil imports from Russia, but there could be a spillover impact in the form of high inflation and sluggish growth.
  • On March 13, Morgan Stanley lowered India’s GDP forecast for the fiscal year 2023 by 50 basis points to 7.9%. After that, the UN report downgraded India’s 2022 GDP to 4.6% due to the war.
  • More risks could arise if global growth conditions weaken further, which would hamper India’s export and capital expenditure cycle.

INFLATIONARY CONCERNS:

  • India depends on imports to meet up to 85% of its crude oil needs. The surge in international oil prices to a 14-year high will now result in broader price pressures.
  • The impact on India’s economy will be felt mostly through higher cost-push inflation weighing in on all economic agents—households, businesses, and government.
  • Every 10% rise in crude oil prices leads to a 0.4 percentage point rise in consumer inflation.
  • It is estimated that retail inflation at 6% for the fiscal year 2023 is much higher than the RBI’s 4.5%.
  • An increase of U.S.$25/bbl. would lead to an estimated reduction in the growth of 0.7% points and an increase in inflation of nearly 1% point. If the prices of other imported commodities also increase, the inflation impact will be higher.
  • This has increased the risks of a higher import bill and, in turn, a widening of India’s current account deficit (CAD).
  • A study by the RBI in 2019 had estimated an increase in the current account
  • deficit (CAD) following a U.S.$10/bbl. increase in global crude price, to be nearly 0.4% points of GDP. Thus, for an increase of U.S.$25/bbl. in global crude prices, the CAD may increase by 1% point of GDP.
  • The RBI Professional Forecasters Survey’s median estimate of CAD at 1.9% of GDP for 2022-23 may have to be revised upwards to 2.9%.

INDIA’S DEFENCE SUPPLIES:

  • Between 2016 and 2020, India accounted for nearly 25% of Russia’s total arms exports. This explains that the share of defense expenditure in India’s budget every year is not little.
  • This time, a key defense contract in question is the delivery of the Russia-developed S-400 air missile system worth $5 billion, which was signed in October 2018.
  • Moreover, the Indian Army’s main battle tank force is composed predominantly of Russian T-72 M1 and T-90S, accounting for 66% and 30% of all units, respectively.
  • India will continue to rely on Russian weapons systems in the middle term, despite the US’s threat of sanctions over the S-400 purchase looms large over India.

OTHER AREAS:

  • POST-COVID DISRUPTION: The geopolitical uncertainty coupled with the likely slowdown in the global economy and high inflation could lead to a major spike in gold prices, as central banks are left with limited legroom to raise interest rates.
  • DIGITAL CURRENCIES: Day one of the conflicts also witnessed 8 percent of cryptocurrencies’ market capitalization of $1.59 trillion being wiped out.
  • SEMICONDUCTORS: Russia and Ukraine are both suppliers of raw materials used in semiconductor manufacturing. Russia is the leading producer of palladium, essential for memory and sensor chips. And Ukraine is a leading exporter of highly purified neon gas that is used in etching circuit designs into silicon wafers to create chips.
  • PHARMA: India exported over $181 million worth of pharmaceutical goods to Ukraine in FY21, growing nearly 44 percent over FY20, while exports to Russia were nearly $591 million in FY21, with YoY growth of 6.95 percent.
  • TEA: Russia is one of the biggest importers of Indian tea, with a share of 18 percent in Indian tea exports.
  • SUNFLOWER OIL: Indians, as the country depends almost totally on Ukraine and Russia for sunflower oil imports. In 2020-21, India imported 1.9 million tonnes of crude sunflower oil, of which Ukraine accounted for 1.4 million tonnes. The rest came from Russia.
  • IMPACT ON PAYMENT SETTLEMENT: Due to the discontinuation of transactions through SWIFT, there would be some disruption in trade to and from Russia and Ukraine.

WHAT ARE THE CHALLENGES FOR RBI AND GOI IN RECENT TIMES?

  • Policymakers may have to exercise a critical choice regarding who bears the burden of higher prices of petroleum products in India among consumers and industrial users, oil marketing companies, and the Government.
  • If the oil marketing companies are not allowed to raise the prices of petroleum products, the bill for oil sector-linked subsidies would go up.
  • If the central and State governments reduce excise duty and value-added tax (VAT) on petroleum products, their tax revenues would be adversely affected.
  • If, on the other hand, the burden of higher prices is largely passed on to the consumers and industrial users, the already weak investment and private consumption would suffer further.
  • If growth is to be revived, maximum attention should be paid to supporting consumption growth and reducing the cost of industrial inputs to improve capacity utilization.
  • If RBI reduces the interest rate, it will further increase the money supply, which will lead to further higher inflation. If the RBI increases the interest rate, it will reduce the money supply in the economy but will impact the economic recovery negatively.

THE WAY FORWARD:

  • As a short-term measure, the Rupee-Rouble trade agreement should be finalized as soon as possible.
  • Notional policy on semiconductors should be promoted effectively so that India could become self-reliant in semiconductor and chip making.
  • RBI should take more liberal steps i.e. accommodative monetary policy. As developed countries are being forced to raise their interest rates and inflationary pressures continue to mount in India and abroad, the RBI may find it advisable to raise the policy rate to stem inflationary pressures and the outward flow of the U.S. dollar even as the growth objective would be served by fiscal policy initiatives.
  • For recovery, maximum attention should be paid to supporting consumption growth and reducing the cost of industrial inputs to improve capacity utilization.
  • India should increase the capacity of its strategic petroleum reserve so that at the time of a war-like situation, India can manage the impact of hiked crude oil prices, in a long term manner, needs to focus on renewable energy sources.
  • To address the shortage of sunflowers oil, the government should take steps to promote domestic cultivation of the oil like the government is doing for palm oil under National Mission on Edible Oils – Oil Palm (NMEO-OP).

THE CONCLUSION: World leaders should come together not for discussing the scale of sanctions but to work out ways to resolve the issue and put an end to the mayhem. Diplomatic channels should be used to have dialogue, negotiate, convince and arrive at amicable solutions to end the conflicts. The increased spate of sanctions on one country is a pain to other dependent countries and it disrupts the world order. Prolonged armed conflicts will worsen the plight of innocent countries and their people.

Economic Impacts of Russia-Ukraine War, Economic Impacts on The World, Recession Ahead for the Russian Economy, European Economies, Inflation & Global Trade Disruptions, India’s Trade with Russia and Ukraine, India’s Defence Supplies, Impact on Payment Settlement


ANTIMICROBIAL RESISTANCE

THE CONTEXT: According to a report published in The Lancet (Global burden of Bacterial AMR in 2019: A Systematic Analysis) about 4.95 million deaths in 2019 are associated with AMR and 1.27 million deaths were caused due to AMR. Anti-microbial Resistance is a leading cause of death around the world, with the highest number of deaths occurring in low-resource settings. Everyone is at risk from AMR, but young children are particularly affected. The following article explains the causes of AMR and the challenges involved, from a scientific and public health perspective.

ABOUT AMR

  • Antimicrobial resistance is the resistance acquired by any microorganism (bacteria, viruses, fungi, parasites, etc.) against antimicrobial drugs (such as antibiotics, antifungal, and antiviral drugs) that are used to treat infections. As a result, standard treatments become ineffective, infections persist, and may spread to others.
  • Resistant microbes are more difficult to treat which necessitates alternative mechanisms or higher doses, both of which are either more toxic or expensive.
  • Microorganisms that develop antimicrobial resistance are sometimes referred to as “superbugs”.
  • Antimicrobial resistance occurs naturally, but the misuse of antibiotics in humans and animals is accelerating the process. Antimicrobial resistance is now regarded as a major threat to public health across the globe.

Bacterial antimicrobial: resistance occurs when changes in bacteria cause the drugs used to treat the infection to become less effective.

CAUSES OF ANTIBIOTIC RESISTANCE

OVERUSE:

  • Overuse of antibiotics by consuming more antibiotics than prescribed.
  • Overuse of antibiotics in livestock and fish farming. Consumption of antibiotically treated livestock such as chicken further increases resistance.
  • Using antibiotics in farm animals can promote AMR. Drug-resistant bacteria can be found in meat and food crops that have exposure to fertilizers or contaminated water. The chances of Zoonotic diseases passing on to humans can increase.

MISUSE:

  • Misuse by taking a prescribed antibiotic incorrectly or taking antibiotics to treat viral infection. Patients generally do not complete the entire antibiotic course.
  • Include self-medication.
  • access to antibiotics without prescription.
  • Lack of knowledge about when to use antibiotics.

PHARMA WASTE AND DISCHARGE:

  • Antibiotics discharge or waste from pharma firms and hospitals. For instance, Hyderabad’s pharmaceutical industry has been pumping massive amounts of antibiotics into local lakes, rivers, and sewers. This has led to an explosion in resistance genes in these water bodies.

HEALTHCARE SETTINGS:

  • Poor infection control in healthcare settings.
  • Poor hygiene and sanitation.
  • A report on hand-washing practices of nurses and doctors found that only 31.8% of them washed hands after contact with patients.

EXCESSIVE USE OF FDC DRUGS:

  • Excessive use of Fixed Dose Combinations (FDC) Drugs due to their low price and convenience enables anti-biotic resistance to grow at a significant rate. This may also lead to the emergence of bacterial strains resistant to multiple antibiotics.

WRONG DIAGNOSIS:

  • Health professionals sometimes prescribe antimicrobials “just in case,” or they prescribe broad-spectrum antimicrobials when a specific drug could have satisficed. Using medications in such a fashion increases the risk of AMR.

RISING CHALLENGES BECAUSE OF AMR

THREAT TO PREVENTION OF INFECTIONS: Medical procedures such as organ transplantation, cancer chemotherapy, diabetes management and major surgery (for example, cesarean sections or hip replacements) will become very risky.

GLOBAL THREAT: AMR poses a serious threat to global health, food security, and development.

SIDE EFFECTS: Increased side effects from the use of multiple and more powerful medications.

COSTS AND CASUALTIES:

  • The danger of antimicrobial resistance is those treatable illnesses like pneumonia, tuberculosis, or minor infections could become incurable. This would put a greater economic and emotional burden on families and on our healthcare system.
  • Increased cost and length of treatments and increased deaths.

RISK TO GAINS MADE IN THE PAST:

  • Without effective antibiotics for the prevention and treatment of infections, the achievements of modern medicine are put at a risk.
  • Antimicrobial resistance is putting the gains of the Millennium Development Goals at risk and endangers the achievement of the Sustainable Development Goals.

ANTIBIOTIC APOCALYPSE:

  • Without urgent positive action, we might be heading to a future without antibiotics, with bacteria becoming completely resistant to treatment and when common infections and minor injuries could even prove fatal.

STEPS TAKEN BY THE WORLD HEALTH ORGANISATION (WHO)

GLOBAL ACTION PLAN:

Global action plan on antimicrobial resistance with 5 strategic objectives:

  • To improve awareness and understanding of antimicrobial resistance.
  • To strengthen surveillance and research.
  • To reduce the incidence of infection.
  • To optimize the use of antimicrobial medicines.
  • To ensure sustainable investment in countering antimicrobial resistance.

REVISION OF ANTIBIOTICS PROTOCOL:

WHO has revised the antibiotics protocol to curb antibiotic resistance in 2017. This was the biggest revision of the antibiotics section in the essential medicines list (EML) which is being used by countries to develop their own local lists of essential medicine.

  • Under this, WHO has divided the drugs into 3 categories viz – access, watch, and reserve.
  • The access category includes commonly used antibiotics available at all times for the treatment of a broad range of common infections.
  • The watch category covers antibiotics that are recommended as a first or second choice treatment for a small group of infections. Prescription of these drugs should be minimized to avoid further development of resistance.
  • The reserved category includes antibiotics that are considered last-resort options and should be used only in the most severe circumstances like life-threatening infections caused by multi-drug resistant (MDR) bacteria.

ANTIMICROBIAL RESISTANCE IN INDIA

  • AMR is of particular concern in developing nations, including India, where the burden of infectious disease is high and healthcare spending is low. India is among the nations with the highest burden of bacterial infections and hence the impact of AMR is likely to be higher in the Indian setting.
  • India has been referred to as ‘the AMR capital of the world’. While on one hand, the emergence of newer multi-drug resistant (MDR) organisms pose newer diagnostic and therapeutic challenges, on the other hand, India is still striving to combat old enemies such as tuberculosis, malaria, and cholera pathogens, which are becoming more and more drug-resistant.
  • Factors such as poverty, illiteracy, overcrowding, and malnutrition further compound the situation. Lack of awareness about infectious diseases in the general masses and inaccessibility to healthcare often preclude them from seeking medical advice.
  • According to the World Health Organisation (WHO), antibiotic resistance may cause an increase in the death of Indians to 20 lakhs per year by 2050.
  • The National Health Policy 2017 highlights the problem of antimicrobial resistance and calls for effective action to address it.
  • MDR-TB and XDR-TB in India: The World Health Organisation estimates approximately 4.1 million people across the world suffer from tuberculosis, but these cases continue to remain undiagnosed and unreported. A total of 1.5 million people died from TB in 2020 making it the second leading infectious killer only after Covid-19.
  • MDR-TB: Multidrug Resistant TB
  • XDR-TB: Extremely Drug-Resistant TB
  • While India is on a mission to become TB free by 2025, the report by Haystack Analytics indicates that the country continues to bear the largest share of TB cases in the world, with 65% of the cases being reported in the most economically productive population segment of 15-45. Not only this can have a detrimental impact on the economy, but the situation can also aggravate considerably, if not addressed in due time.
  • XDR-TB has become a new threat to the control of TB in many countries including India. Its prevalence is not known in India as there is no nationwide surveillance. However, there have been some reports from various hospitals in the country

STEPS TAKEN BY INDIA IN FIGHT AGAINST AMR

RED LINE CAMPAIGN:

  • It was launched in 2016.
  • Under this, Prescription only antibiotics were marked with a red line to curb irrational use.
  • The government has also backed it up with an awareness campaign that red-line medicines should not be taken without a prescription.

ANTI-MICROBIAL RESISTANCE FUND:

  • India-focused seed fund.
  • Investment by the Department of Biotechnology (DBT) through the Biotechnology Industry Research Assistance Council (BIRAC).
  • It will help groups in India compete for the Longitude prize (for groups that develop effective and affordable diagnostic kits to detect antimicrobial resistance).

AMRRSN:

National Anti-Microbial Resistance Research and Surveillance Network (AMRRSN) was established by the Indian Council of Medical Research (ICMR).

  • To strengthen surveillance of AMR in the country.
  • To enable compilation of national data of AMR at various levels of health care.

NATIONAL ACTION PLAN TO COMBAT ANTIMICROBIAL RESISTANCE, 2017:

  • Enhancing awareness among the masses and strict adulteration laws.
  • Strengthening surveillance.
  • Improving the rational use of antibiotics.
  • Reducing infections.
  • Promoting policies and research in antimicrobial resistance.
  • Support neighboring nations in the fight against infectious diseases

AMR RESEARCH & INTERNATIONAL COLLABORATION:

  • ICMR has taken measures to develop new drugs /medicines using international collaborations for strengthening medical research in AMR.

INITIATIVES TO CONTROL OVERUSE OR MISUSE OF ANTIBIOTICS:

  • ICMR has launched an antibiotic stewardship program (AMSP) on a pilot project basis in twenty tertiary care hospitals across India to check the misuse and overuse of antibiotics in hospital wards and ICUs.
  • On the advice of ICMR, DCGI has prohibited 40 fixed-dose combinations (FDCs) which were found inapplicable.
  • ICMR collaborated with the Indian Council of Agriculture Research, Department of Animal Husbandry, Dairy and Fisheries, and the DCGI to prohibit the use of Colistin as a growth promoter in animal feed in poultry.
  • The government has also capped the maximum levels of drugs that can be used for growth promotion in meat and meat products.

CHALLENGES FOR INDIA IN ITS FIGHT AGAINST AMR

TWIN CHALLENGE:

  • India faces a twin challenge of fighting the over consumption of antibiotics while ensuring that the poor and vulnerable have easy access.

LACK OF AWARENESS:

  • Lack of awareness among medical practitioners as well as the general public on the rational use of antibiotics further aggravates the problem.

COORDINATION GAP:

  • Coordination among various ministries and between the center and state governments.
  • A cross-cutting program dealing with antimicrobial resistance across multiple microbes has been lacking.

ABSENCE OF A ONE HEALTH APPROACH:

  • One Health Approach to addressing AMR recognizes that human well-being is inextricably tied to the health of animals and the environment.

ABSENCE OF STRINGENT RULES:

  • The absence of stringently framed and implemented regulatory frameworks to limit the use of antimicrobials in livestock and food animals, especially for non-therapeutic purposes, has been one of the drivers of antibiotic overuse at the community level.
  • The rules and regulations that were taken were not strict enough to prevent pharmaceutical firms to sell last-resort drugs to farmers or discharging waste into water bodies.
  • In India, current effluent standards do not include antibiotic residues, and thus they are not monitored in the pharmaceutical industry effluents.

THE WAY FORWARD

  • Infection control in healthcare facilities:
  • Health professionals prescribe antibiotics only when they are needed.
  • Preventing infections by maintaining hygiene.
  • Creating awareness about the use and abuse of antibiotics:
  • Individuals to use antibiotics only when prescribed.
  • Only give antibiotics to animals under veterinary supervision.
  • Vaccinate animals to minimize the need for antibiotics.
  • Use alternatives to antibiotics when available.
  • A robust national action plan to tackle antibiotic resistance.
  • Improve surveillance of antibiotic-resistant infections.
  • Invest in R&Dfor new antibiotics to keep up with resistant bacteria as well as in new diagnostic tests to track the development of resistance.

THE CONCLUSION: There is a need to urgently address antimicrobial resistance in a holistic way by integrating human, animal and environmental health. All countries need to work together to limit the spread of Antibiotic-Resistant Genes (ARGs). Even though national action plans have been laid down by most countries, these plans have yet to move from paper to the ground as antibiotics continue to be freely used,therefore to contain AMR, there is a need for a One Health Approach through coherent, integrated, multi-sectoral cooperation and actions.

MAINS QUESTIONS:

  1. “Addressing AMR requires a multipronged and multisectoral approach. The urgency to develop new drugs should not discourage us from instituting measures to use the existing antimicrobials judiciously.” Comment.
  2. “The progress under the National Action Plan for AMR(2017) has been far from satisfactory.” Critically analyze.
  3. What do you understand by Antimicrobial Resistance (AMR)? Explain the reasons for the spread of AMR and the challenges involved to control it.


HOW DID THE LI-ION BATTERY SET OFF A TECHNOLOGY REVOLUTION?

THE CONTEXT: Recently, the Union Minister of Road Transport and Highways said rapid strides in technology and green fuel will reduce the cost of electric automobiles, bringing them at par with petrol-run vehicles in two years. Also, the 2019 Nobel Prize for Chemistry was awarded to John B. Goodenough, M. Stanley Whittingham, and Akira Yoshino for working towards the development of practical lithium-ion batteries.
In this context, this article analyses the scope of the Lithium-Ion Battery Market: Industry Trends, Share, Size, Growth, Opportunity, and the way forward.

THE EXPLANATION

What is a lithium-ion battery and how does it work?

  • A lithium-ion battery is a type of rechargeable battery that is charged and discharged by lithium ions moving between the negative (anode) and positive (cathode) electrodes. (Generally, batteries that can be charged and discharged repeatedly are called secondary batteries, whereas disposable batteries are called primary batteries.)
  • Because lithium-ion batteries are suitable for storing high-capacity power, they are used in a wide range of applications, including consumer electronics such as smartphones and PCs, industrial robots, production equipment, and automobiles.

Lithium-ion Battery – Applications

⦁ Electronic gadgets
⦁ Tele-communication
⦁ Aerospace
⦁ Industrial applications
⦁ Lithium-ion battery technology has made it the favorite power source for electric and hybrid electric vehicles

SIGNIFICANCE OF LI-ION BATTERIES IN THE CONTEXT OF THE ELECTRONIC MARKET

According to the Ministry of Commerce and Industry, India imported lithium cells and batteries – including rechargeable li-ion type devices – worth INR 8,984 crore in the last fiscal year (2020-2021). This figure consisted of INR 173 crore of non-rechargeable lithium devices and INR 8,811 crore of lithium-ion products.
China and Hong Kong were the chief sources of imports with China shipping 72.73% of the lithium-ion products imported by India and 32.05% of the non-rechargeable lithium cell devices. Hong Kong products accounted for 23.48% and 37.32% of those respective markets.
Indian lithium battery demand is expected to surge with the products used in renewable energy storage facilities and electric vehicles as well as data centers and consumer electronics. According to other data, the Indian lithium-ion battery market reached a value of US$ 2.1 Billion in 2021.

THE DOMESTIC PUSH

Recently, the Geological Survey of India has taken up seven other lithium exploration projects in Karnataka, Arunachal Pradesh, Andhra Pradesh, Chhattisgarh, Jharkhand, Jammu and Kashmir, and Rajasthan.

The reason: The ancient igneous rock deposits in the region (a by-product of large-scale volcanic activity in the Deccan plateau millions of years ago) hold the first traces of Lithium ever to be discovered in India

MAJOR IMPACTS ON E-VEHICLES: A POTENTIAL ALTERNATIVE TO REDUCE THE COAL DEPENDENCY

One of the major factors driving the rising demand for Lithium-Ion batteries is the growing popularity of electric cars. Rising EV sales across the country, particularly in the 2- and 3-wheeler segments, have boosted the demand. Lithium batteries have transformed how they are utilized due to their advantages over lead-acid batteries.

By 2030, the market for electric vehicle 

power packs are expected to reach $300 billion, with a large secondary market of more than 2.5 million e-rickshaws and 4,00,000 lead-acid battery-powered two-wheelers now on the road.

The most expensive component of an electric car is the lithium-ion battery, which accounts for 40-50 percent of the total cost. With the growing use of electric vehicles in our transportation system, the demand for Li-ion batteries for EV applications is expected to soar. Other uses, such as renewable energy integration with the grid, will raise Li-Ion battery demand in addition to electric vehicles.

According to government projections, India would require a minimum of 10 GWh of Li-ion cells by 2022. By 2025, it will be around 60 GWh, and by 2030, it will be around 120 GWh.

Environmental Aspect:

  • According to the World Air Quality Report 2021, published by Swiss Organization -IQ Air where it stated “India was home to 11 of the 15 most polluted cities in Central and South Asia in 2021. Delhi saw a 14.6% increase in PM2.5 concentrations in 2021, with levels rising to 96.4 µg/m3 from 84 µg/m3 in 2020.
  • It also highlighted that sources of PM2.5 “include internal combustion engines, power generation, industrial processes, agricultural processes, construction, and residential wood and coal burning.
  • According to a Government source, by 2030, nearly three-fourths of Indian two-wheelers and all new cars are expected to be EVs (electric vehicles). It will significantly reduce the dependency on coal and reduce pollution significantly.

MERITS OF LI-ION BATTERIES

Compared to their lead-acid counterparts, lithium-ion batteries are much lighter, more efficient, and have more power storage. These batteries are widely used commercially in mobiles, laptops, and other electronic equipment.

High energy density: High energy density is one of the chief advantages of lithium-ion battery technology. With electronic equipment such as mobile phones needing to operate longer between charges while still consuming more power, there is always a need for batteries with a much higher energy density.

For example, NiMH batteries would not be able to provide the charge capacity required for a modern smartphone. Using Nickel Metal Hydride battery technology, a smartphone would not last long enough, especially if the battery needed to keep within the same size constraints.

In addition to this, there are many power applications from power tools to electric vehicles. The much higher power density offered by lithium-ion batteries is a distinct advantage. Electric vehicles also need battery technology that has a high energy density.

Self-discharge: One issue with many rechargeable batteries is the self-discharge rate. The rate of self-discharge of Li-ion cells is much lower than that of other rechargeable cells such as Ni-Cad and NiMH forms. It is typically around 5% in the first 4 hours after being charged but then falls to a figure of around 1 or 2% per month.

Low maintenance: One major lithium-ion battery advantage is that they do not require maintenance to ensure their performance.
Ni-Cad cells required a periodic discharge to ensure that they did not exhibit the memory effect. As this does not affect lithium-ion batteries and cells, this process or other similar maintenance procedures are not required. Likewise, lead-acid cells require maintenance, some needing the battery acid to be topped up periodically.

Cell voltage: The voltage produced by each lithium-ion cell is about 3.6 volts. This has many advantages. Being higher than that of the standard nickel-cadmium, nickel-metal hydride, and even standard alkaline cells at around 1.5 volts and lead-acid at around 2 volts per cell, the voltage of each lithium-ion cell is higher, requiring fewer cells in many battery applications. For smartphones, a single cell is all that is needed and this simplifies the power management.

Variety of types available: There are several types of lithium-ion cells available. This advantage of lithium-ion batteries can mean that the right technology can be used for the application needed. Some forms of lithium-ion battery provide a high current density and are ideal for consumer mobile electronic equipment. Others can provide much higher current levels and are ideal for power tools and electric vehicles.

DEMERITS OF LI-ION BATTERIES

Fire Risk: Lithium-ion batteries, whether they are used in cars or electronic devices, can catch fire if they have been improperly manufactured or damaged, or if the software that operates the battery is not designed correctly.

The major weakness of lithium-ion batteries in electric cars is the use of organic liquid electrolytes, which are volatile and flammable when operating at high temperatures. An external force such as a crash can also lead to chemical leakage.

Protection/battery management system required: Lithium-ion cells and batteries are not as robust as some other rechargeable technologies. They require protection from being overcharged and discharged too far. In addition to this, they need to have the current maintained within safe limits. Accordingly, one lithium-ion battery disadvantage is that they require protection circuitry incorporated to ensure they are kept within their safe operating limits.

Aging: One of the major lithium-ion battery disadvantages for consumer electronics is that lithium-ion batteries suffer from aging. Not only is this time or calendar dependent, but it is also dependent upon the number of charge-discharge cycles that the battery has undergone.

Often batteries will only be able to withstand 500 – 1000 charge-discharge cycles before their capacity falls. With the development of Li-ion technology, this figure is increasing, but after a while, the battery may need replacing and this can be an issue if they are embedded in the equipment.

Cost: A major lithium-ion battery disadvantage is its cost. Typically, they are around 40% more costly to manufacture than Nickel-cadmium cells. This is a major factor when considering their use in mass-produced consumer items where any additional costs are a major issue.

Developing technology: Although lithium-ion batteries have been available for many years, they can still be considered an immature technology by some as it is very much a developing area. This can be a disadvantage in terms of the fact that the technology does not remain constant. However as new lithium-ion technologies are being developed all the time, it can also be an advantage as better solutions are coming available.

GOVERNMENT INITIATIVES TO PROMOTE ELECTRIC VEHICLES

  • India is the fourth-largest auto market globally, and some estimates suggest there are close to 170 active investors in the country’s EV start-up ecosystem.
  • To promote the adoption of EVs, the Department of Heavy Industry formulated a FAME India Scheme (Faster Adoption and Manufacturing of (Hybrid and) Electric Vehicles in India) in 2015.

The government has launched the following initiatives to Promote Electric Vehicles in India:

  • Under the new GST system, GST on EVs is reduced from 12% to 5% against the 28% GST rate with up to 22% for conventional vehicles.
  • The government has proposed the exemption of registration fees for battery-operated/electric vehicles to promote eco-friendly vehicles in the country.
  • The Ministry of Power has also allowed the sale of electricity as a ‘service’ for electric vehicles’ charging. It will attract investors into the charging infrastructure.
  • Also, The government has granted an exemption to battery-operated transport vehicles and vehicles that run on methanol and ethanol fuels from the requirements of the permit.
  • The Ministry of Road Transport and Highways has allowed 16-18 years to obtain driving licenses to drive e-scooters.
  • Lithium wars: Battery makers are also seeking to take advantage of the ₹18,100-crore production-linked incentive (PLI) scheme to manufacture lithium-ion cells within the country. In such a scenario, securing lithium supplies will play a critical role in the pivot towards a greener economy.

THE CONCLUSION: The use of Lithium-ion batteries is the future of a greener and eco-friendly environment. The use of lithium-ion batteries helps in cutting down the pollution level and improving the air quality. Energy storage and mobility are going to be the most popular concept in India as they won’t only save us costs but also have a huge positive impact on climate change. With the introduction of different government initiatives, the Indian Government is also trying to promote the use of batteries for a secure future. Having a manufacturing unit in India will help in cost reduction and increase employment.
Along with the batteries being manufactured, they can be recycled and reused too, decreasing the usage of gas and leading to an increase in pollution levels. For a better future, we need to start working today and have a clear vision toward the goal.

THE MAIN PRACTICE QUESTIONS:

  • The Noble Prize in Chemistry of 2019 was jointly awarded to John B. Goodenough, M. Stanley Whittingham, and Akira Yoshino for working towards the development of practical lithium-ion batteries. How has this invention impacted the everyday life of human beings?
  • What are the present challenges before the transition of shifting to e-vehicles? How do emerging technologies provide an opportunity for reducing coal dependency?


EUROPEAN DECLARATION ON DIGITAL RIGHTS AND PRINCIPLES FOR THE DIGITAL DECADE

THE CONTEXT: The European Commission has proposed a set of digital rights and principles in January 2022 that aim to protect people’s rights, support democracy, and ensure a fair and safe online environment. The European Parliament and the Council of the European Union will discuss the proposal before its adoption. This article explains the major features of the declaration and its significance.

THE SALIENT FEATURES OF THE DECLARATION

PEOPLE AT THE CENTRE OF THE DIGITAL TRANSFORMATION:

  • Technology should serve and benefit all Europeans and empower them to pursue their aspirations in full security and respect for their fundamental rights. This requires:
  • Strengthening the democratic framework for a digital transformation that benefits everyone and improves the lives of all Europeans.
  • Fostering responsible and diligent action by all digital actors, public and private, for a safe and secure digital environment.

SOLIDARITY AND INCLUSION:

  • Everyone should have access to technology that aims at uniting and not dividing people. The digital transformation should contribute to a fair society and economy in the Union. These needs:

(a) Making sure that technological solutions respect people’s rights, enable their exercise, and promote inclusion.

(b) Developing adequate frameworks so that all market actors assume their responsibilities and make a fair contribution to the costs of public goods and services.

CONNECTIVITY, DIGITAL EDUCATION, AND SKILLS:

  • Everyone, everywhere in the EU, should have access to affordable and high-speed digital connectivity. Everyone has the right to education, training, and lifelong learning and should be able to acquire all basic and advanced digital skills. This requires:

(a) Ensuring access to excellent connectivity for everyone, wherever they live and whatever their income.

(b)Promoting and supporting efforts to equip all education and training institutions with digital connectivity, infrastructure, and tools.

WORKING CONDITIONS:

  • Everyone has the right to fair, just, healthy, and safe working conditions and appropriate protection in the digital environment as in the physical workplace, regardless of their employment status, modality or duration. This needs:

(a) Ensuring that everyone shall be able to disconnect and benefit from safeguards for work-life balance in a digital environment.

A fair online environment:

  • Everyone should be able to effectively choose which online services to use based on objective, transparent and reliable information. This requires:

(a) Ensuring a safe, secure.

(b) A fair online environment where fundamental rights are protected, and the responsibilities of platforms, especially large players and gatekeepers, are well defined.

PARTICIPATION IN THE DIGITAL PUBLIC SPACE:

  • Everyone should have access to a trustworthy, diverse, and multilingual online environment. Access to diverse content contributes to a pluralistic public debate and should allow everyone to participate in democracy. This requires:

(a) Supporting the development and best use of digital technologies to stimulate citizen engagement and democratic participation.

(b) Continuing safeguarding fundamental rights online, notably the freedom of expression and information.

PRIVACY AND INDIVIDUAL CONTROL OVER DATA:

  • Everyone has the right to the protection of their data online. That right includes the control on how the data are used and with whom they are shared.
  • Everyone has the right to the confidentiality of their communications and the information on their electronic devices, and no one shall be subjected to unlawful online surveillance or interception measures.
  • Everyone should be able to determine their digital legacy and decide what happens with the publicly available information that concerns them after their death.

SUSTAINABILITY:

  • To avoid significant harm to the environment and promote a circular economy, digital products and services should be designed, produced, used, disposed of, and recycled to minimise their negative environmental and social impact. This requires:

(a) Supporting the development and use of sustainable digital technologies that have minimal environmental and social impact.

(b) Developing and deploying digital solutions with a positive impact on the environment and climate.

SIX THEMES OF THE DECLARATION IN A NUTSHELL

THE RATIONALE BEHIND THE EUROPEAN DECLARATION ON DIGITAL RIGHTS AND PRINCIPLES

ACCELERATION IN DIGITAL TRANSFORMATION:

  • Digital transformation offers significant opportunities for a better quality of life, innovation, economic growth, and sustainability. But it also presents new challenges for the fabric, security, and stability of societies and economies.
  • With the acceleration of the digital transformation, the time has for the European Union (EU) to spell out how its values and fundamental rights should be applied in the online world.

A CONTINUITY IN DATA PROTECTION APPROACHES:

  • The European Parliament has made several calls for ensuring the full compliance of the Union’s approach to the digital transformation with fundamental rights such as data protection or non-discrimination and with principles such as technological and net neutrality and inclusiveness.
  • It has also called for strengthened protection of users’ rights in the digital environment. This declaration is in furtherance of such initiatives and approaches.

BUILDING ON PREVIOUS INITIATIVES:

  • This declaration builds on previous initiatives such as the “Tallinn Declaration on e-Government”, the “Berlin Declaration on Digital Society and Value-based Digital Government”, the “Lisbon Declaration – Digital Democracy with a Purpose”, “Path to the Digital Decade” etc. which calls for a model of digital transformation that strengthens the human dimension of the digital ecosystem with the Digital Single Market as its core.

GUIDING PRINCIPLES FOR THE MARKET:

  • The declaration aims to explain shared political intentions.
  • Not only does it recall the most relevant rights in the context of the digital transformation, but it also serves as a reference point for businesses and other relevant actors when developing and deploying new technologies.

FLAG POSTS FOR POLICYMAKERS:

  • The democratic oversight of the digital society and economy should be further strengthened, fully respecting the rule of law principles, effective justice, and law enforcement.
  • Thus, the declaration will guide policymakers when reflecting on their vision of the digital transformation: putting people at the center of the digital transformation, underlying solidarity, and inclusion, restating the importance of freedom of choice, etc.

PROMOTING BEST PRACTICES:

  • The Union shall promote the declaration in its relations with other international organizations and third countries.
  • The principles can serve as an inspiration for international partners to guide a digital transformation that puts people and their human rights at the center throughout the world.

A CRITICAL EVALUATION OF THE DECLARATION

  • Despite the solemn character of the draft declaration, this text does not purport to exercise any legally binding role. Its ‘political nature is made explicit in the declaration itself and the accompanying communication. as the preamble recalls, it remains declaratory and, even if endorsed, will not set out legal obligations.
  • The declaration has not been introduced as an EU Charter of Fundamental Rights 2.0, a document with potential constitutional value.
  • The declaration does not have any direct mechanism of enforcement. The EU Commission, however, has proposed to use this document as a guide to assess the status of the digital transition across the EU in the form of an annual report.

EU PARLIAMENT AGREES ON PROPOSAL TO TAKE ON U.S. TECH GIANTS

In the European Parliament in Jan 2022 signed off on a proposal for new rules aimed at U.S. tech giants, paving the way for talks on the plan with member countries and the European Commission. The Digital Services Act, a proposal from the EU antitrust chief would force Amazon, Apple, Alphabet unit Google and Facebook owner Meta to do more to tackle illegal content on their platforms or risk fines up to 6% of global turnover. The proposal still needs to be ironed out with EU countries and lawmakers before it can become law, the first of its kind in the world. The European Parliament adopted the proposal with 530 votes in favour, 78 against, and 80 abstentions.

“With a huge majority, the European Parliament adopted the Digital Services Act. A big win, with support from the left to right,” Dutch lawmaker Paul Tang said on Twitter. Christel Schaldemose, a Danish lawmaker leading the Parliament’s negotiating team, said: “Online platforms have become increasingly important in our daily life, bringing new opportunities and new risks. We have to make sure that what is illegal offline is illegal online.” France, which holds the rotating EU presidency, aims for an agreement in the first half of 2022.

AN ANALYSIS OF THE DIGITAL RIGHTS AND PRIVACY: THE INDIAN SCENARIO

‘Digital rights’ is a broad term: it can imply the right to privacy and data protection; it can be related to trolling, online threats, and hate speech; it can address broader issues of equitable Internet access regardless of economic background and disabilities. In India, where citizens’ data are at the mercy of companies and government and where is no privacy law, the Puttaswamy judgment, and the Justice B.N. Srikrishna committee report that led to the Personal Data Protection Bill of 2019 came as a ray of hope. But the Joint Committee report on the Bill has failed to provide a robust draft of legislation ensuring the privacy of citizens.

Earlier, the Central government introduced IT Rules 2021 which is also being criticized as putting disproportionate restrictions on digital freedom. Instead, it is held that it carved out an architecture for a surveillance state. Digital marketing has resulted in the compromise of the personal data integrity of the users and such data is being exploited commercially. There are also many instances of a data breach on the part of both public and private players including the UIDAI.

The lack of accountability of the tech giants is an acute problem in India despite their huge influence on public policy and governance matters. These issues have been echoed in Parliament recently where members urged the government to end the “systematic influence and interference of Facebook and other social media giants” on electoral politics being used to “hack democracy”. Last year, Facebook (Meta)was accused of allowing algorithms to amplify hate speech. Whistle-blowers Sophie Zhang and Frances Haugen have testified against the company’s policies. Haugen told British lawmakers that the social media company stokes online hate and extremism, fails to protect children from harmful content and lacks any incentive to fix the problems.

EU, INDIA, 8 OTHER COUNTRIES CALL FOR INT’L COOPERATION ON DATA PROTECTION

In a ‘Joint Declaration on Privacy and the Protection of Personal Data: Strengthening trust in the digital environment’, the European Union, Australia, Comoros, India, Japan, Mauritius, New Zealand, South Korea, Singapore, and Sri Lanka said rapid technological developments, in particular in information and digital technologies, have brought benefits for their economies and societies, as well as new challenges for privacy and the protection of personal data.

To foster data free flow with trust, which, as also acknowledged by the G20 Rome Leaders’ Declaration, is key to harnessing the opportunities of the digital economy, it is vital to ensure, as guaranteed by these countries’ respective legal frameworks, respect for individuals’ right to privacy and the protection of personal data as a core value and fundamental freedom, said the declaration.

They called for comprehensive legal frameworks and policies covering both the private and public sectors. They underlined core principles such as lawfulness, fairness, transparency, purpose limitation, data minimisation, limited data retention, data security, and accountability. They also called for enforceable rights of individuals, such as access, rectification, deletion, and safeguards concerning automated decision-making such as transparency and the possibility to challenge the outcome.

The joint declaration emphasised safeguards for international transfers to enable cross-border data flows by ensuring that the protection travels with the data. It also called for independent oversight by a dedicated supervisory authority and effective redress.

THE WAY FORWARD

GENERATE AND SPREAD DIGITAL AWARENESS: 

  • Similar to many other Internet bills of rights promoted in the past few years by civil society groups and other international organisations, the EU declaration on digital rights and principles plays an important advocacy role in raising public awareness among citizens, institutions, and companies.

DEVELOP DIGITAL REGULATORY CAPABILITY:

  • In a time when rapid global digital advancement consistently outpaces regulatory frameworks and institutions of State agencies in the multilateral domain, the declaration represents a unique step toward a human rights-based approach to digital governance and inclusion.
  • However, they will remain mere declaratory without regulatory and governance mechanisms to enforce these rights.

A BENCHMARK FOR OTHER COUNTRIES:

  • The declaration deals with very substantive aspects of the digital ecosystem including digital equality and oversight of tech companies. It provides a template for other countries/blocs so that they can streamline and update their own digital governances policies.

BALANCING THE RIGHTS OF THE MARKET, GOVERNMENT, AND CONSUMERS:

  • The attempt to rein in the “Big-Tech Power” has been ongoing worldwide, including in the USA, Australia, India, etc.
  • Although it is necessary to demand and enforce accountability on these companies, this should not lead to a situation of government control over citizens’ data.
  • Also, the rights of the market, the free flow of data, and the development of the digital economy should not become a casualty.

LEGAL AND POLICY CERTAINTY IN INDIA:

  • India requires a comprehensive digital law and policy system that integrate privacy, regulation, legitimate government control, and scope for digital entrepreneurship. The current Data Protection Bill requires serious overhauling so are the IT Act 2000 and other associated rules and policies.

THE CONCLUSION: The Declaration furthers the global conversation on digital constitutionalism, translating constitutional principles to address the challenges of the digital revolution. It reiterates that the digital world is not a lawless space: Existing fundamental rights are as valid online as they are offline. It is a good step towards promoting a safe, reliable, accountable, and equitable digital space that can benchmark other nations/groupings.

QUESTIONS:

  • Comment on the salient features of the European Declaration on Digital Rights and Principles, 2022. How far do you think that they can address the problems of inequality, poor social inclusion, and lack of accountability in the digital ecosystem?
  • “The European Declaration on Digital Rights and Principles, 2022 is although right in intent but lacks substance”. Critically Examine


ECONOMIC SURVEY 2021-22: CHAPTER 10- SOCIAL INFRASTRUCTURE AND EMPLOYMENT

THE INTRODUCTION: The need for a strong and resilient social infrastructure became even more important during the ongoing COVID-19 pandemic that brought into focus the vulnerabilities in social infrastructure across countries. Specifically, the pandemics posed the challenge of balancing livelihoods while saving lives. To save lives and livelihoods amidst the COVID crisis, countries have adopted various strategies. India, the country with the second-largest population and a large elderly population, adopted a multi-pronged approach. The government’s response through ‘Aatmanirbhar Bharat Abhiyan’ packages and other sector-specific initiatives have provided the necessary support to mitigate the adverse impact of a pandemic. This chapter gives a brief account of India’s response to Social Infrastructure and Employment.

INDIA’S HEALTH RESPONSE TO THE COVID-19

Like most other countries, India also faced two COVID-19 waves: the first in 2020 and the second in 2021. To save lives, the Government adopted a multi-pronged approach viz.

  1. Restrictions/partial lockdowns,
  2. Building capacity in health infrastructure,
  3. COVID-19 appropriate behavior, testing, tracing, treatment
  4. Vaccination drive.

COVID VACCINATION STRATEGY

  • Guided by scientific and epidemiological evidence, World Health Organisation (WHO) guidelines, and global best practices, India’s National COVID Vaccination Program has been one of the world’s largest vaccination programs.
  • Government of India procured 75 percent of monthly vaccine production and provided it free to States and UTs, while the rest could be procured by private hospitals.
  • Availability of Vaccine: The ICMR funded the clinical trials of the COVISHIELD vaccine developed in collaboration with Oxford – Astra Zeneca. COVISHIELD and COVAXIN have been widely used vaccines in India. Every month about 250- 275 million doses of COVISHIELD and 50-60 million doses of COVAXIN have been produced.
  • Pricing and equity: At all Government COVID-19 Vaccination Centres (CVCs), the COVID-19 vaccine was made available free of cost for all eligible citizens.
  • Coverage: From 1st May 2021, all 94 crore persons of age 18 years and above, were made eligible for COVID vaccination. From 3rd January 2022, COVID-19 vaccine coverage has been extended to the age group of 15-18 years. Till 19th January 2022, 3.73 crore youngsters between 15-18 age group have been vaccinated with 1st dose of COVID-19 vaccine covering more than 50 percent of youngsters.
  • Vaccine hesitancy: To reduce vaccine hesitancy, the Government made efforts that include awareness by identified experts. From 3rd November 2021, a campaign, ‘Har Ghar Dastak’, has been initiated to identify and vaccinate those who missed 1st dose and are due for 2nd dose through house-to-house mobilization activity.
  • Technology-driven: Arogya Setu mobile app was launched to enable people to assess the risk of their catching the COVID-19 infection.
  • Vaccination Progress: As of 16th January 2022, a total of 156.76 crore doses of COVID-19 vaccines have been administered: 90.75 crores first dose and 65.58 crores second dose.

Population vaccinated by country (in percent)

TRENDS IN SOCIAL SECTOR EXPENDITURE

  • Government’s spending on social services increased significantly during the pandemic. In 2021-22 (BE), Centre and State governments earmarked an aggregate of ` 71.61 lakh crore for spending on the social service sector; an increase of 9.8 percent over 2020-21.
  • Last year’s (2020-21) revised expenditure has also gone up by ` 54,000 crores from the budgeted amount. In 2021-22 (BE), funds to the sector increased to 8.6 percent of Gross Domestic Product (GDP) (8.3 percent in 2020-21).
  • During the last five years, social services accounted for about 25 percent of the total Government expenditure (Centre and States taken together). In 2021-22 (BE), it was 26.6 percent.
  • Expenditure in the health sector increased from ` 2.73 lakh crore in 2019-20 (pre-COVID-19) to ` 4.72 lakh crore in 2021-22 (BE), an increase of nearly 73 percent.
  • Union Budget 2021-22, announced Ayushman Bharat Health Infrastructure Mission, a new Centrally Sponsored Scheme, with an outlay of about ` 64,180 crores in the next five years to develop capacities of primary, secondary, and tertiary care Health Systems
  • Union Budget 2021-22 provided an outlay of Rs 35,000 crore towards COVID-19 vaccination.
  • The National Health Policy, 2017 envisaged increasing the government’s health expenditure to 2.5 percent of GDP by 2025.

EDUCATION

  • During initial COVID-19 restrictions, as a precautionary measure to protect the students from COVID-19, schools, and colleges were closed across India. This posed a new challenge for the Government in terms of continuity of education.
  • School Infrastructure An assessment for the pre-pandemic year of 2019-20 for which data is available reveals that the number of recognized schools & colleges continued to increase between 2018-19 and 2019-20, except for primary & upper primary schools.

SCHOOL INFRASTRUCTURE

  • An assessment for the pre-pandemic year of 2019-20 for which data is available reveals that the number of recognized schools & colleges continued to increase between 2018-19 and 2019-20, except for primary & upper primary schools.

  • Toilets (girls or boys), drinking water, and hand-washing facilities are now available in most Government schools (10.32 lakh).
  • Priority to drinking water and sanitation in schools under Jal Jeevan Mission, Swachh Bharat Mission as well as under Samagra Shiksha Scheme has been instrumental in providing required resources and creating these assets in schools.
  • As of 19.01.2022, under Jal Jeevan Mission 8,39,443 schools were provided a tap water supply.
  • Availability of teachers, measured by Pupil-Teacher Ratio, an indicator whose decrease signals improvement in quality of education, has improved at all levels continuously from 2012-13 to 2019-20: from 34 to 26 at primary, 23 to 18 at upper primary, 30 to 18 at secondary, and 39 to 26 at the higher secondary level.

Schools with Basic Facilities

SCHOOL ENROLMENT

  • In 2019-20, 26.45 crore children were enrolled in schools. During the year, schools enrolled about 42 lakh, additional children, out of which 26 lakh were in primary to higher secondary levels and 16 lakh were in pre-primary as per the Unified District Information System for Education plus (UDISE+) database.
  • The enrollments increased across all levels viz., upper-primary, secondary, and higher secondary, except for the primary level. At the primary level, enrollment reduced from 13.5 crores in 2012-13 to 12.2 crores in 2019-20. This decline in enrollment was because of a decline in the total number of children in the age group 6-10 years.

 School Gross Enrollment Ratios in India (in percent)

SCHOOL DROP-OUT

  • the years 2019-20 saw a decline in dropout rates at primary, upper-primary, and secondary levels. In 2019-20, the school dropout rate at the primary level declined to 1.45 percent from 4.45 percent in 2018-19.
  • ASER found that despite the pandemic, enrollment in the age cohort of 15-16 years continued to improve as the number of not enrolled children in this age group declined from 12.1 percent in 2018 to 6.6 percent in 2021.

Major Initiatives for Students during the COVID-19 pandemic

PM e-VIDYA: Major components

  • One Nation, One Digital Education (DIKSHA) Platform
  • One Class, One TV channel through Swayam Prabha TV Channels
  • Extensive use of Radio, Community Radio, and Podcasts
  • One DTH channel is being operated specifically for hearing impaired students in sign language.

National Digital Education Architecture (NDEAR): A digital infrastructure for Education, was launched on 29th July 2021.

Vidyanjali: To connect the Government and Government aided schools through a community/ volunteer management program.

Major Schemes for School Education during 2021-22

  1. Samagra Shiksha Scheme has been continued for a period of five years, from 2021-22 to 2025-26.
  2. NIPUN Bharat Mission: On 5th July 2021, the government launched a National Mission on Foundational Literacy and Numeracy called “National Initiative for Proficiency in Reading with Understanding and Numeracy (NIPUN Bharat)”.
  3. Pradhan Mantri Poshan Shakti Nirman (PM POSHAN) Scheme: The Scheme, earlier known as the ‘National Programme for Mid-Day Meal in Schools”, covers all school children studying in Balvatika (just before class I) and Classes I-VIII in Government and Government-Aided Schools.

HIGHER EDUCATION

  • Gross enrollment ratio in higher education was recorded at 27.1 percent in 2019-20, slightly higher than 26.3 percent in 2018-19. For males, it has also increased from 26.3 percent in 2018-19 to 26.9 percent in 2019-20 while for females it has increased from 26.4 percent to 27.3 percent respectively.

Gross Enrollment Ratios in Higher Education for age 18-23 years (in percent)

SKILL DEVELOPMENT

  • To unlock the demographic dividend, several steps have been taken to increase the skill levels in the population. Periodic Labour Force Survey (PLFS) 2019-20 shows that formal vocational/technical training among youth (age 15-29 years) and working population (age 15-59 years) have improved in 2019-20 over 2018-19.
  • The improvement in skills has also been for males and females, both in rural and urban sectors. However, formal training for males and females is lower in rural than in urban areas.
  • As per the report of the first quarter (April-June, 2021) of the Quarterly Employment Survey (QES) in respect of establishments employing at least 10 workers in major nine sectors, 17.9 percent of estimated establishments were imparting formal skill training.

SKILL INDIA MISSION

  • Launched in 2015, Skill India Mission focuses on re-skilling and up-skilling in prominent trades. Under the Mission, the government implements Pradhan Mantri Kaushal Vikas Yojana (PMKVY), Jan Shikshan Sansthan (JSS) Scheme, and National Apprenticeship Promotion Scheme (NAPS), for providing short term Skill Development training and Craftsman Training Scheme (CTS), for long term training, to the youth.

Pradhan Mantri Kaushal Vikas Yojana (PMKVY)

  • PMKVY has two training components, viz., Short Term Training (STT) and Recognition of Prior Learning (RPL). Between 2016-17 and 2021-22 (as of 15 January 2022 ), under PMKVY 2.0 about 1.10 crore persons were trained (inclusive of the placement-linked and non-placement-linked components of the PMKVY).

Jan Shikshan Sansthan (JSS) Scheme

  • JSS aims to provide vocational skills to non-literate, neo-literates, persons with a rudimentary level of education up to 8th and school dropouts up to 12th standard in the age group of 15-45 years. The priority groups are women, SC, ST, minorities, Divya Gyan, and other backward sections of the society.

National Apprenticeship Promotion Scheme (NAPS)

  • This Scheme promotes apprenticeship training and the engagement of apprentices by providing financial support to industrial establishments undertaking apprenticeship programs under The Apprentices Act, 1961. As of 31 October 2021, 4.3 lakh apprentices are engaged under the scheme.

Craftsmen Training Scheme (CTS)

  • CTS is for providing long-term training in 137 trades through 14,604 Industrial Training Institutes (ITIs) across the country. For session 2020, 13.36 lakh trainees were enrolled.

 TRENDS OF EMPLOYMENT

In the absence of high-frequency data on labour market indicators, other proxies such as subscriptions to the EPFO scheme and demand for work under MGNREGA, have been used to analyze the more recent trends in employment in urban and rural sectors.

Trends in Urban employment using Quarterly PLFS data

  • In the first quarter of 2020-21, the unemployment rate for the urban sector rose to 20.8 percent. The LFPR and WPR in the urban sector also declined significantly during this quarter.

  • The UR gradually declined during this period to reach 9.3 percent in Q4 of 2020-21. The UR for males as well as females, aged 15 & above, recovered to the pre-pandemic levels.

TRENDS IN DATA ON DEMAND FOR WORK UNDER MGNREGS

  • During the nationwide lockdown, the aggregate demand for MGNREGS work peaked in June 2020, and has thereafter stabilized.
  • During the second COVID wave, demand for MGNREGS employment reached the maximum level of 4.59 crore persons in June 2021. Nonetheless, after accounting for seasonality, the demand at an aggregate level still seems to be above the pre-pandemic levels of 2019.
  • For some states like Andhra Pradesh and Bihar, the demand for work under MGNREGS has reduced to below the pre-pandemic levels during the last few months.
  • Intuitively, one may expect that higher MGNREGS demand may be directly related to the movement of migrant labouri. e. source states would be more impacted. Nevertheless, state-level analysis shows that for many migrant source states like West Bengal, Madhya Pradesh, Odisha, Bihar, the MGNREGS employment in most months of 2021 has been slower than the corresponding levels in 2020.
  • In contrast, the demand for MGNREGS employment has been higher for migrant recipient states like Punjab, Maharashtra, Karnataka, and Tamil Nadu for most months in 2021 over 2020.

Long-term trends in employment using annual PLFS data

  • During the Periodic Labour Force Survey (PLFS) 2019-20 (survey period from July 2019 to June 2020), employment at its usual status continued to expand. Between 2018-19 and 2019-20, about 4.75 crore additional persons joined the workforce.
  • This is about three times more than the employment created between 2017-18 and 2018-19.

POLICY RESPONSES TO BOOST RURAL LIVELIHOOD

Incentives for job creation: Aatmanirbhar Bharat Rojgar Yojana (ABRY) was announced as a part of the Aatmanirbhar Bharat 3.0 package to boost the economy, increase the employment generation in the post-Covid recovery phase, and incentivize the creation of new employment along with social security benefits and restoration of loss of employment during COVID-19 pandemic.

Wage employment: To boost employment and livelihood opportunities for returnee migrant workers, Garib Kalyan Rojgar Abhiyaan was launched in June 2020. It focused on 25 target-driven works to provide employment and create infrastructure in the rural areas of 116 districts of 6 States with a resource envelope of Rs 50,000 crore.

Boosting Self-employment:

  • The program targets to mobilize about 9-10 crore households into Self Help Groups (SHGs).
  • Till December 2021, 8.07 crore households are mobilized into SHGs.

Social protection:

  • Pradhan Mantri Shram Yogi Maan-Dhan (PM-SYM) Yojana, launched on 05.03.2019, is a voluntary and contributory pension scheme for providing a monthly minimum assured pension of ` 3000 upon attaining the age of 60 years.
  • As of 17.01.2022, the enrollment under the PMSYM scheme is 46.09 lakh persons, out of which female enrollment was 23.89 lakh and male enrollment was 22.20 lakh.

e-SHRAM Portal

  • e-SHRAM portal has been launched to create a National Database of Unorganized Workers (UWs). One of the main objectives of this portal is to facilitate the delivery of Social Security Schemes to the workers. This database is seeded with Aadhaar and for the age group between 16-59 years.
  • It includes construction workers, migrant workers, gig workers, platform workers, agricultural workers, MGNREGA workers, fishermen, milkmen, ASHA workers, Anganwadi workers, street vendors, domestic workers, rickshaws pullers, and other workers engaged in similar other occupations in the unorganized sector.

Status of Labour Reforms

  • In 2019 and 2020, 29 Central Labour laws were amalgamated, rationalized, and simplified into four labor codes, viz., the Code on Wages, 2019 (August 2019), the Industrial Relations Code, 2020, the Code on Social Security, 2020, and the Occupational Safety, Health & Working Conditions Code, 2020 (September 2020).
  • The new laws were in tune with the changing labour market trends and at the same time accommodated the minimum wage requirement and welfare needs of the unorganized sector workers.

HEALTH

PROGRAMMES AND SCHEMES FOR THE HEALTH SECTOR

  • Ayushman Bharat Health and Wellness Centres (AB-HWCs): The vision of Ayushman Bharat is to achieve universal health coverage. It adopts a continuum of care approach, comprising two inter-related components. The first component is the creation of 1,50,000 Health and Wellness Centres (HWCs) which cover both, maternal and child health services and non-communicable diseases, including free essential drugs and diagnostic services.
  • Ayushman Bharat Pradhan Mantri Jan Arogya Yojana (AB-PMJAY): The scheme provides a health cover of ` 5 lakhs per family per year for secondary and tertiary care hospitalization to over 10.74 crores of poor and vulnerable families in the bottom 40 percent of the Indian population.
  • PM-Ayushman Bharat Health Infrastructure Mission (PM-ABHIM) is a mission to develop the capacities of primary, secondary, and tertiary care health systems, strengthen existing national institutions, and create new institutions, to cater to the detection and cure of new and emerging diseases. It is the largest pan-India scheme for public health infrastructure since 2005.
  • Pradhan Mantri Swasthya Suraksha Yojana (PMSSY) is being implemented to correct regional imbalances in the availability of affordable reliable tertiary healthcare services and to augment facilities for quality medical education in the country.
  • Ayushman Bharat Digital Mission (ABDM), erstwhile National Digital Health Mission (NDHM), announced on 27th September 2021 to develop the backbone necessary to support the integrated digital health infrastructure of the country.
  • e-Sanjeevani: In wake of the COVID-19 pandemic, the Ministry of Health and Family Welfare upgraded the thee-Sanjeevani application to enable patient-to-doctor teleconsultation to ensure a continuum of care and facilitate health services to all citizens in the confine of their homes free of cost.

HEALTH OUTCOME INDICATORS

As per the latest National Family Health Survey (NFHS)-5, social indicators such as total fertility rate, sex ratio, and health outcome indicators viz., infant mortality rate, under-five mortality rate, institutional birth rates have improved over the year 2015-16.

CHILD HEALTH INDICATORS
  • All child nutrition indicators have also improved at all Indian levels. Under Five Mortality Rate (U5MR) has declined from 49.7 in 2015-16 to 41.9 in 2019-21. Infant Mortality Rate (IMR) has declined from 40.7 per 1000 live births in 2015-16 to 35.2 per 1000 live births in 2019-21.
  • Stunting has declined from 38 percent in 2015-16 to 36 percent in 2019-21. Wasting has also declined from 21 percent in 2015-16 to 19 percent in 2019-21. And, underweight declined from 36 percent in 2015-16 to 32 percent in 2019-21.
LIFE EXPECTANCY
  • Life expectancy at birth was 69.4 years for the period 2014-18; it has increased by 0.4 years from 2013-17. It varies widely across states; ranging from the lowest at 65.2 years in Chhattisgarh to the highest at 75.3 years in Kerala and Delhi. It is higher in urban areas (72.6 years) than in rural areas (68.0 years).

DRINKING WATER AND SANITATION

JAL JEEVAN MISSION (JJM)
  • In 2019, out of about 18.93 crore families in rural areas, about 3.23 crore (17 percent) rural families had tap water connections in their homes. As of 2 January 2022, 5,51,93,885 households have been provided with a tap water supply since the start of the mission.
  • Six states/ Uts have achieved the coveted status of 100 percent households with tap water supply, namely Goa, Telangana, A & N Islands, Puducherry, Dadra, Nagar Haveli, Daman and Diu, and Haryana.
SWACHH BHARAT MISSION (GRAMEEN) [SBM-G]
  • During 2021-22 (as of 25.10.2021) a total of 7.16 lakh Individual household latrines for new emerging households and 19,061 Community Sanitary Complexes have been constructed. Also, 2,194 villages have been declared as ODF Plus.
  • As per the recently released findings of the fifth round of the National Family Health Survey, 2019-21 (NFHS-5), the population living in households that use an improved sanitation facility has increased from 48.5 percent in 2015-16 to 70.2 percent in 2019-21.
ELECTRICITY AND CLEAN COOKING FUEL
  • As per NFHS-5, 58.6 percent of households were using clean fuel for cooking in 2019-21, a significant increase from 43.8 percent in 2015-16.

RURAL DEVELOPMENT

PRADHAN MANTRI AWAAS YOJANA-GRAMIN (PMAY-G)
  • In the first phase from 2016-17 to 2018-19, one crore houses were taken up. Under phase II, assistance is being provided for the construction of the remaining 1.95 crore houses from 2019-20 to 2021-22.
  • As of 18th January 2022, 2.17 crore houses have been sanctioned and 1.69 crore houses completed against a target of 2.63 crore houses till 2021-22.

PRADHAN MANTRI GRAM SADAK YOJANA (PMGSY)

  • As of 18.01.2022, a total of 1,82,506 roads measuring 7,82,844 km and 9,456 Long Span Bridges (LSBs) have been sanctioned and 1,66,798 roads measuring 6,84,994 km and 6,404 LSBs have been completed.
  • World Bank (2019) in an evaluation of the scheme found that PMGSY roads had a positive impact on human capital formation in rural India.

MULTIDIMENSIONAL POVERTY (MPI)

  • Using the NFHS-4 (2015-16) report, in line with the global Multidimensional Poverty Index (MPI), NITI Aayog prepared Multidimensional Poverty Index at the national, for all states and districts of India.
  • It will enable measuring deprivation across twelve indicators at the national, state, and districts level. In 2015-16, 25 percent of households were found to be multidimensional poor in India.
  • Among states, Bihar had the largest (51.91%) multidimensional poor households, followed by Jharkhand (42.16%), Uttar Pradesh (37.79%), Madhya Pradesh (36.65%), Assam (32.67%), and Rajasthan (39.46%).
  • Since the MPI index is based on NFHS-4 data of 2014-15, it may serve as the baseline for measuring deprivation in future studies.


ECONOMIC SURVEY 2021-22: CHAPTER 9- SERVICES

THE INTRODUCTION: Services sector contributes over 50 percent to India’s GDP. While the Covid-19 pandemic has hurt most sectors of the economy, the services sector has been the worst affected as its’ share in India’s GVA declined from 55 percent in 2019-20 to 53 percent in 2021-22.1 Within the services sector, the effect of Covid-19 has been varied. While non-contact services such as information, communication, financial, professional, and business services have remained resilient, the impact has been much more severe on contact-based services such as tourism, retail trade, hotel, entertainment, recreation, etc.

IMPACT OF COVID-19 AND SEQUENTIAL RECOVERY

  • The services sector contracted by 8.4 percent Year on Year (YoY) in 2020-21 (Table 1). This decline was driven by a sharp contraction of 18.2 percent YoY in the sub-sector ‘Trade, hotels, transport, communication & services related to broadcasting.
  • Owing to its contact-intensive nature, the services included in this sub-sector had to bear the maximum brunt of the disruptions caused by the prevailing pandemic.
  • The sub-sector ‘Public administration, defense & other services’ includes expenditure by the government and services such as health, education, recreation, etc, on the other, contracted by 4.6 percent YoY in 2020-21.

  • The relatively less contact intensive sub-sector ‘Financial, real estate & professional services’ was the least impacted, with a marginal decline of 1.5 percent YoY in its GVA during 2020-21.

TRENDS IN HIGH-FREQUENCY INDICATORS

The upturn in Services GVA, when seen with the trend in high-frequency indicators such as Purchasing Managers Index (PMI) Services Index, freight and passenger traffic point to a pickup in economic momentum.

SERVICES PMI

  • India’s services sector activity, gauged by PMI services, which had contracted for five consecutive months since March 2020, recovered sharply in October 2020. It dropped again for three consecutive months (May, June, and July 2021) as a consequence of the second Covid-19 wave. Notably, the contraction during May-July 2021 was not as sharp as seen during the first lockdown.
  • With the easing of restrictions, PMI Services started to grow once again from August 2021 recording the strongest jump in over 10 years to 58.4 in October 20213 (Figure 1(a)). PMI index moderated to 55.5 in December 2021.

FREIGHT TRAFFIC

  • As the economy gradually opened up in June 2020, freight traffic also improved. Freight traffic registered strong growth during April- June 2021, partly reflecting the rebound from the low base during the same period last year. The impact of the second covid wave in April-May 2021 on these indicators was much more muted as compared to during the full lockdown in March-May 2020.

BANK CREDIT TO THE SERVICES SECTOR

  • Bank credit growth to the services sector which had moderated significantly in 2019, started picking up in 2020, increasing to 8.8 percent (YoY) at the end of December 2020, as compared to 6.2 percent in December 2019 (Figure 2). This momentum has lost its pace in 2021-22.
  • Bank credit growth decelerated to 3.6 percent YoY at the end of November 2021 as compared to 8.2 percent a year ago. However, it is important to note that corporates have raised more money through capital markets than banking capital in 2021-22 so far.

SERVICES SECTOR SHARES AT THE STATE AND UT LEVEL

  • The services sector accounts for more than 50 percent of the Gross State Value Added (GSVA) in 12 out of the 33 states and UTs (Table 3). Chandigarh stands out with a particularly high share of services in GSVA at 74 percent while Sikkim’s share remains the lowest at 24.25 percent. Notably, the Services share in Sikkim’s GSVA has increased from over 18 percent in 2018-19 to over 24 percent in 2020-21. Similarly, over the last three years, the share of services in GSVA has increased by over 4 percent for Himachal Pradesh and Odisha. Maharashtra and Karnataka are the top two contributors to services GSVA, with Rs 15.1 lakh crore and Rs 9.71 lakh crore gross value added by the services sector in 2020-21 respectively.
  • Due to the Covid-19 pandemic and restrictions on movement, GSVA in the services sector declined in 2020-21 relative to the pre-pandemic year 2019-20. This is true for 13 out of 20 states for which data is available. During 2020-21, services GSVA contracted by almost 11 percent in Rajasthan and almost 10 percent in Jharkhand and Punjab. On the other hand, Sikkim achieved the highest growth of 11.71 percent in services GSVA during 2020-21.

FDI IN SERVICES

  • The Services Sector was the largest recipient of FDI inflows in India. During H1 2021-22, Services Sector received $ 16.73 billion in FDI equity inflows. “Financial, Business, Outsourcing, R&D, Courier, Tech testing & Analysis along with Education sub-sector witnessed strong FDI inflows”, mentioned the Survey.

TRADE-IN SERVICES

  • India had a dominant presence in global services exports. It remained among the top ten services exporter countries in 2020, with its share in world commercial services exports increasing to 4.1% in 2020 from 3.4% in 2019. “The impact of Covid-19 induced global lockdown on India’s services exports was less severe as compared to merchandise exports”.
  • Despite Covid-19’s impact on transport exports, double-digit growth in gross exports of services, aided by exports of software, business, and transportation services, resulting in an increase of 22.8% in net exports of services in H1 2021-22.

SUB-SECTOR WISE PERFORMANCE

IT-BPM (INFORMATION TECHNOLOGY – BUSINESS PROCESS MANAGEMENT) SECTOR

  • IT-BPM sector as a major segment of India’s services. During 2020-21, according to NASSCOM’s provisional estimates, IT-BPM revenues (excluding e-commerce) reached $ 194 billion, growing by 2.26% YoY, adding 1.38 lakh employees.
  • Within the IT-BPM sector, IT services constitute the majority share (>51%). The Economic Survey observed that over the last year, several policy initiatives have been undertaken to drive innovation and technology adoption in the sector, including relaxation of Other Services Provider regulations, Telecom Sector Reforms, and Consumer Protection (e-commerce) Rules, 2020.
  • This would significantly expand access to talent, increase job creation and catapult the sector to the next level of growth and innovation.

STARTUPS AND PATENTS

  • Startups in India had grown remarkably over the last six years, most of which belonged to the Services Sector. More than 61,400 startups have been recognized in India as of January 10, 2022.
  • India had a record number of Startups (44) reaching unicorn status in 2021.
  • intellectual property, specifical patents were key to a knowledge-based economy.
  • The number of patents filed in India has gone up to 58,502 in 2020-21 from 39,400 in 2010-11 and the patents granted in India have gone up to 28,391 from 7,509 during the same period.

Tourism Sector

  • The tourism sector was a major contributor to GDP growth, foreign exchange earnings, and employment, however, the Covid-19 pandemic had a debilitating impact on world travel and tourism everywhere, including India.
  • The resumption of International tourism will continue to depend largely on a coordinated response among countries in terms of travel restrictions, harmonized safety, and hygiene protocols, and effective communication to help restore consumer confidence.
  • Special international flights have been operating under the Vande Bharat Mission which was currently in its 15thphase and had carried over 63.55 lakh passengers.

PORTS, SHIPPING, AND WATERWAYS SERVICES

  • The development of ports was crucial for the economy. Ports handled around 90% of export-import cargo by volume and 70% by value.
  • The total cargo capacity of all ports had increased to 1,246.86 Million Tonnes Per Annum (MTPA) as of March 2021 from 1052.23 MTPA in March 2014.
  • Also, the Port traffic had picked up in 2021-22 registering a growth of 10.16% during April-November 2021, after being hit by disruptions caused by Covid-19 in 2020-21.
  • The Sagarmala Programme, a flagship program, aimed at promoting port-led development in the country with 802 projects worth Rs. 5.53 lakh crore under its ambit.

SPACE SECTOR

  • Since its inception in the 1960s, the Indian space program has grown drastically. Capabilities have been developed in the space sector across all domains including indigenous space transportation systems, space assets comprising a fleet of satellites catering to various needs of the society.
  • The Government undertook various reforms in the space sector in 2020, envisaging participation of the private sector in providing space-based services. These reforms included empowering New Space India Limited (NSIL) and changing the present supply-based model to a demand-driven model; creating an independent nodal agency i.e. Indian National Space Promotion and Authorization Centre (IN-SPACe) under the Department of Space; and providing a predictable, forward-looking, well defined and enabling regulatory regime for space activities in the country.

HIGHLIGHTS

  • GVA of services crossed pre-pandemic level in July-September quarter of 2021-22; however, GVA of contact intensive sectors like trade, transport, etc. still remain below pre-pandemic level.
  • Overall service Sector GVA is expected to grow by 8.2 percent in 2021-22.
  • During April-December 2021, rail freight crossed its pre-pandemic level while air freight and port traffic almost reached their pre-pandemic levels, domestic air, and rail passenger traffic are increasing gradually – showing the impact of the second wave was much more muted as compared to during the first wave.
  • During the first half of 2021-22, the service sector received over US$ 16.7 billion in FDI – accounting for almost 54 percent of total FDI inflows into India.
  • IT-BPM services revenue reached US$ 194 billion in 2020-21, adding 1.38 lakh employees during the same period.
  • Major government reforms include, removing telecom regulations in the IT-BPO sector and opening up of space sector to private players.
  • Services exports surpassed the pre-pandemic level in the January-March quarter of 2020-21 and grew by 21.6 percent in the first half of 2021-22 – strengthened by global demand for software and IT services exports.
  • India has become 3rd largest start-up ecosystem in the world after US and China. The number of newly recognized start-ups increased to over 14000 in 2021-22 from 733 in 2016-17.
  • 44 Indian start-ups have achieved unicorn status in 2021 taking the overall tally of unicorns to 83, most of which are in the services sector.


ECONOMIC SURVEY 2021-22: CHAPTER 8- INDUSTRY AND INFRASTRUCTURE

THE INTRODUCTION: Global Industrial activity continued to be affected by the disruptions caused by the COVID-19 pandemic. While the Indian industry was no exception to these disruptions, its performance has improved in 2021-22. Gradual unlocking of the economy, record vaccinations, improvement in consumer demand, continued policy support towards industries by the government in the form of Atma Nirbhar Bharat Abhiyan, and further reinforcements in 2021-22 have led to an upturn in the performance of the industrial sector. The introduction of the production linked incentive scheme (PLI) to encourage scaling up of industries and a major boost provided to infrastructure-both physical as well as digital– combined with continued measures to reduce transaction costs and improve ease of doing business, would support the pace of recovery.

INDEX OF INDUSTRIAL PRODUCTION (IIP)

  • The impact of the pandemic on the industrial sector is reflected in the negative growth of 8.4 percent in 2020-21. From April-November 2021-to 22 the IIP grew by 17.4 percent as compared to (-15.3) percent in the corresponding period of the previous year.
  • The supply-side measures as also steps to bolster demand, taken to address the contraction, are responsible for the significantly improved performance of the industrial sector in 2021-22.
  • In November 2021 the IIP index grew by 1.4 percent with the mining sector recording a growth of 5.0 percent followed by electricity at 2.1 percent and manufacturing at 0.9 percent.

EIGHT CORE INDEX (ICI)

  • The monthly Index of Eight Core Industries (ICI) measures the collective and individual performance of production in selected eight core industries like Coal, Crude Oil, Natural Gas, Refinery Products, Fertilizers, Steel, Cement, and Electricity. This is an index of the eight most fundamental industrial sectors of the Indian economy and comprises 40.27 percent of the weight in IIP.
  • The growth rate of the ICI index during the period of April-November 2021-22 was 13.7 percent as compared to (-)11.1 percent in the corresponding period of the last financial year. This acceleration in ICI is mainly driven by improved performance in steel, cement, natural gas, coal, and electricity. Fertilizers and crude oil registered a negative growth of 0.6 percent and 2.7 percent respectively.

GROSS FIXED CAPITAL FORMATION

  • Gross fixed capital formation (GFCF) is the gross addition to fixed assets like machinery and equipment, intangible assets and indicates the state of investments in the economy. During 2019-20, the share of the industrial sector in total GFCF in the economy (at current prices) was recorded at 30.1 percent, which is slightly lower than 31 percent in the previous financial year.
  • Within the industrial sector, the share of manufacturing in GFCF was 51 percent, followed by electricity at 23 percent, construction at 21 percent, and mining with 5 percent. While aggregate GFCF (at constant prices) grew by 9.9 percent and industrial GFCF grew by 12.4 percent in 2018-19, it grew by 5.4 percent and 3.7 percent respectively in 2019-20.
  • During 2019-20, GFCF in the mining and electricity sectors registered a negative growth of 12.9 percent and 6 percent respectively, but the GFCF grew by 10.2 and 4.4 percent in the manufacturing and construction sectors respectively on a yo-y basis.

CREDIT IN INDUSTRY

  • Gross bank credit to the industrial sector, recorded a growth of 4.1 percent in October 2021 (Y-o-Y basis) compared to a negative growth of 0.7 growth in October 2020.
  • The share of industry in non-food credit stood at 26 percent in October 2021. Certain industries such as mining, textiles, petroleum, coal products and nuclear fuels, rubber, plastic, and infrastructure have shown consistent improvement in credit growth.

FDI IN INDUSTRIES

  • India registered its highest-ever annual FDI inflow of US$ 81.97 billion (provisional) in 2020-21 reflecting a growth of 10 percent as compared to the previous year.
  • The increase has been on the back of growth of 20 percent in 2019-20. In the year 2021-22, FDI inflow grew by 4 percent in the first six months to reach US$ 42.86 billion as compared to US$ 41.37 billion for the same period of last year.
  • Over the last seven financial years (2014-21), India received FDI inflow worth US$ 440.27 billion which is nearly 58 percent of the FDI received by the country in the last 21 years(US$ 763.83 billion).

PERFORMANCE OF CENTRAL PUBLIC SECTOR ENTERPRISES

  • CPSEs are an important constituent of the Indian industry. As of 31.03.2020, 256 CPSEs were operational. The overall net profit of operating CPSEs during 2019-20 stood at Rs. 93,295 crore Contribution of all CPSEs to the central exchequer by way of excise duty, GST, corporate tax, dividend, etc. stood at Rs. 3,76,425 crore.
  • The CPSEs across sectors employed 14,73,810 persons, of which 9,21,876 were regular employees.
  • By Union Budget 2021-22 announcement, the government has approved a policy of strategic disinvestment of public sector enterprises that will provide a clear roadmap for disinvestment in all non-strategic and strategic sectors.
  • The non-strategic CPSEs will be privatized or otherwise shall be closed. Thus, the policy on public sector enterprises provides a clear path for disinvestment in all nonstrategic and strategic sectors and strengthens the idea of Minimum Government – Maximum Governance.

CORPORATE PERFORMANCE

  • With economic recovery, concomitant improvement in demand and improved business sentiments have had a positive effect on the performance of the corporate sector.
  • In response to the favorable base effect, sales of 1,687 listed manufacturing companies recorded steady and broad-based growth of 34.0 percent in Q2: FY22 as compared to (-)4.3 percent growth in Q2: FY21, on an annual (y-o-y) basis.

SECTOR-WISE PERFORMANCE AND ISSUES IN THE INDUSTRY

Steel: The performance of the steel industry is pivotal for the growth of the economy. Despite being hit by COVID-19, the steel industry has bounced back with cumulative production of crude and finished steel in 2021-22(April-October) at 66.91 MT and 62.37 MT, an increase of 25.0 percent and 28.9 percent respectively.

Coal: Coal is the most important and abundant fossil fuel in India and accounts for 55 percent of the country’s energy needs. Coal production increased by 12.24 percent in April-October 2021 as compared to (-) 3.91 percent in April-October 2020. Overall production of raw coal in India during the year 2020-21 was 716.08 million tonnes (provisional) as compared to 730.87 million tonnes achieved in the previous year 2019-20.

Micro Small Medium Enterprise: Micro, Small & Medium Enterprises(MSMEs) contribute significantly to the economic and social development of the country by fostering entrepreneurship and by generating employment opportunities. The relative importance of MSMEs can be gauged from the fact that the share of MSME GVA in total GVA (current prices) for 2019-20 was 33.08 percent. The CHAMPIONS portal is an ICT-based technology system for making the smaller units big by helping and hand-holding them.

The key features of the portal include:

  • Information dissemination: Regular updates on recent development in the MSME sector.
  • To resolve the grievances in a fast track manner, all Nationalised Banks, a good number of Private/Regional Rural Banks, State Financial Corporations, Central Government Ministries/ Departments, State Governments, and CPSEs have been boarded on the portal.
  • Scheme/Programme-wise mapping of officials of the Ministry for fast-track responses to grievances.
  • Integration with various portals such as MSME Samadhaan, Udyam Registration, CPGRAM, etc.

Textiles: Textile industry is the second-largest employment generator in the country, next only to agriculture. In the last decade, close to Rs. 203,000 crores have been invested in this industry with direct and indirect employment of about 105 million people, a major part of which is women. Despite the industry being deeply affected by the lockdown, it has shown a remarkable recovery with a positive contribution to growth, as reflected by IIP, of 3.6 percent from April-October 2020.

Electronics Industry: Government accords high priority to electronics hardware manufacturing. The government has therefore notified the National Policy on Electronics 2019 (NPE 2019) on 25.02.2019 to position India as a global hub for Electronics System Design and Manufacturing (ESDM) by encouraging and driving capabilities in the country for developing core components, including chipsets. Additionally, NPE 2019 attempts to catalyze the growth of the Indian electronics ecosystem through the

  • Production Linked Incentive (PLI) Schemes for Large Scale Electronics Manufacturing
  • PLI Scheme for IT Hardware
  • Scheme for Promotion of Manufacturing of electronic components and Semiconductors (SPECS)
  • Modified Electronics Manufacturing Clusters 2.0 (EMC 2.0).

Recently, the government has approved an outlay of Rs. 76,000 Crore (>US$ 10 Bn) for the development of the Semiconductors and Display Manufacturing Ecosystem. The government’s intervention to boost this industry has come at a time when the global economy is facing an acute shortage of semiconductors due to severe disruptions in supply chains.

Pharmaceuticals: Indian Pharmaceutical industry ranks third in the world in pharmaceutical production by volume. During 2020-21, total pharma export US$ 24.4 Bn against the total pharma import of US$7.0 Bn. The initiatives taken by the government to address the requirement of the pharmaceutical and medical devices industry are as follows:

  • Bulk Drug Parks that envisages the creation of world-class infrastructure facilities.
  • Bulk drugs have been approved for the promotion of domestic manufacturing of 53 critical APIs.
  • Production linked incentive (PLI) scheme for Pharmaceuticals.
  • Promoting Domestic Manufacturing of Medical Devices was approved on 20th March 2020.

INFRASTRUCTURE

NATIONAL INFRASTRUCTURE PIPELINE (NIP)

  • To achieve a GDP of $5 trillion by 2024-25, India needs to spend about $1.4 trillion over these years on infrastructure. During FYs 2008-17, India invested about US$1.1 trillion in infrastructure. However, the challenge is to step up infrastructure investment substantially.
  • Keeping this objective in view, National Infrastructure Pipeline (NIP) was launched with a projected infrastructure investment of around Rs. 111 lakh crore (US$ 1.5 trillion) during FY 2020-2025 to provide world-class infrastructure across the country and improve the quality of life for all citizens.
  • It also envisages improving project preparation and attracting investment, both domestic and foreign in infrastructure.

NATIONAL MONETISATION PIPELINE (NMP)

  • A robust asset pipeline has been prepared to provide a comprehensive view to investors and developers of the investment avenues in infrastructure. The pipeline includes a selection of de-risked and brownfield assets with a stable revenue generation profile (or long rights) which will make for an attractive investment option.
  • Total indicative value of NMP for core assets of the Central Government has been estimated at Rs 6.0 lakh crore over 4 years (5.4 percent of total infrastructure investment envisaged under NIP).

ROAD TRANSPORT

  • The road network of the country consists of National Highways(NH), State-Highways (SH), District Roads, Rural Roads, Urban Roads, and Project Roads of over 63.71(Provisional) lakh km of roads as of 31 March 2019, which is the second-largest in the world, after the United States with 66.45 lakh km of roads.
  • There has been a consistent increase in the construction of National Highways/roads since 2013-14 with 13,327 km of roads constructed in 2020-21 as compared to 10,237 km in 2019-20, indicating an increase of 30.2 percent over the previous year.

RAILWAYS

  • Being the third-largest network in the world under single management and with over 68,102 route km IR strives to provide a safe, efficient, competitive, and world-class transport system.
  • An average of 1835 track km per year of new track length has been added through new-line and multi-tracking projects during 2014-2021 as compared to the average of 720 track km per day during 2009-14.
  • To strengthen the agriculture sector, as of 31st December 2021, IR has operated 1,841 Kisan Rail services, transporting approximately 6.0 lakh tonnes of perishables including fruits and vegetables.
  • To provide better amenities IR has embarked on providing Wi-Fi internet services at all stations (excluding halt stations). As of 5th December 2021, a total of 6,087 Railway Stations has been equipped with a Wi-Fi facility.

CIVIL AVIATION

  • India has emerged as one of the fastest-growing aviation markets in the world. The domestic traffic in India has more than doubled from around 61 million in 2013-14 to around 137 million in 2019-20, registering a growth of over 14 percent per annum.
  • Till the launching of UDAN in 2016, India had 74 airports have scheduled operations. But, within 4 years under UDAN, four rounds of bidding under RCS-UDAN have taken place and 153 RCS airports including 12 water aerodromes & 36 Helipads have been identified for the operation of RCS flights.

PORTS

  • Port performance in an economy is crucial for the trade competitiveness of that economy. Expansion of port capacity has been accorded the highest priority by the Government through the implementation of well-conceived infrastructure development projects. The capacity of 13 major ports which was 871.52 million tonnes per annum (MTPA) at the end of March 2014, has increased by 79 percent to 1,560.61 MTPA by the end of March 2021.
  • Many initiatives have been taken by the government to improve port governance, augment capacity utilization, enhance port efficiency and connectivity. The measures include the following among others:
  • Sagarmala is a National Programme aimed at accelerating economic development in the country by harnessing the potential of India’s 7,500 km long coastline and 14,500 km of potentially navigable waterways.
  • The Major Port Authorities Act 2021 was notified on 18.2.2021. This act provides for inter alia regulation, operation, and planning of major ports in India and vests the administration, control, and management of such ports upon the Boards of Major Port Authorities.
  • A new Captive Policy for Port Dependent Industries has been prepared to address the challenges of renewal of the concession period, the scope of expansion, and the dynamic business environment.

INLAND WATERWAYS

  • Regulatory amendment through the Inland Vessels Act, 2021, replaced the over 100 years old Inland Vessels Act, 1917 (1 of 1917) and ushered in a new era in the inland water transport sector.
  • Augmentation in navigation capacity of National Waterway-1 (NW-1) is being implemented since 2018 through the Jal Marg Vikas Project from Varanasi to Haldia stretch of the Ganga-Bhagirathi-Hooghly River System to enable large barge movements.
  • Construction of multi-modal terminals at Varanasi and Sahib Ganj has been completed and that of the multimodal terminal at Haldia and the Navigational Lock at Farakka has achieved substantial progress. The other projects such as the comprehensive development of NW-2 and NW-16 &Indo-Bangladesh Protocol (IBP) route are proposed to be undertaken for 5 years for Rs. 461 crores and Rs.145.29 crores respectively, from 2020-21 to 2024-25.

TELECOM

  • The relevance of the telecom sector has increased immensely. This can be gauged from the fact that the total telephone subscriber base in India has increased from 933.02 million in March 2014 to 1200.88 million in March 2021. In March 2021, 45 percent of subscribers were based in rural India and 55 percent in urban areas.
  • Internet penetration in the country is increasing steadily with internet subscribers increasing from 302.33 million in march 2015 to 833.71 million in June 2021. While 67.2 percent of internet subscribers had narrowband connections and 32.8 percent had broadband connections in 2015, the composition had reversed by June 2021 with only 4 percent of subscribers having a narrow band and 96 percent with broadband connections.
  • The number of mobile towers has also increased substantially reaching 6.93 lakhs towers in December 2021, reflecting that the telecom operators have well realized the potential in the sector and seized the opportunity to build up an infrastructure that will be fundamental in boosting the Government’s Digital India campaign.

PETROLEUM, CRUDE, AND NATURAL GAS

  • Crude oil and condensate production during the year 2020-21 was 30.49 million metric tonnes (MMT), lower than the production level of 32.17 MMT in 2019-20 and 94.3 percent of the target of 32.32 MMT for 2020-21. India depends on imports to meet more than 80 percent of its requirements.
  • Natural Gas production during the year 2020-21 was 28.67 billion cubic meters (BCM) as against the production of 31.18 BCM in 2019-20 and 85.4 percent against the target of 33.57 BCM for 2020-21.
  • The production of petroleum products was 233.51 MMT in 2020-21 as against 258.18 MMT in 2019-20, showing achievement of 90.2 percent of the target of 259.02 MMT for 2020- 21.

ELECTRICITY

  • India has witnessed a significant transformation from being an acute power deficit country to a situation of demand being fully met.
  • India has also made remarkable strides to ensure universal access to electricity for every household.
  • The total installed power capacity and captive power plant was 459.15 GW on 31.03.2021 as compared to 446.35 GW on 31.03.2020 registering a growth of 2.87 percent. Installed capacity in utilities was 382.15 GW on 31.03.2021 as compared to 370.11 GW on 31.03.2020 – increasing by 3.25 percent.
  • Thermal sources of energy make the largest – 61.42 percent share of total installed capacity in utilities followed by renewable energy resource (RES) with 24.7 percent and hydro with 12.09 percent.
  • The total electricity generated including that from captive plants during the year 2020-21 was 15.73 lakh GWh as compared to 16.23 lakh GWh during the year 2019-20, of which 13.73 lakh GWh was generated by utilities and 2 lakh GWh in captive plants.

Renewable energy – Solar, Wind, Biomass, and small hydro energy

  • India has witnessed the fastest rate of growth in renewable energy capacity addition among all large economies, during the last 7.5 years with renewable energy capacity growing by 2.9 times and solar energy expanding by over 18 times.
  • To facilitate renewable power evacuation and reshape the grid for future requirements, the Green Energy Corridor (GEC) projects have been initiated. The GEC Project aims at synchronizing electricity produced from renewable sources, such as solar and wind, with conventional power stations in the grid.

THE CONCLUSION: The Government has charted out a comprehensive program for industrial transformation. With an emphasis on supply-side measures, the reforms address long known bottlenecks of insufficient infrastructure, tardy business processes, and labour market reforms. The introduction of the production-linked incentive schemes intends to encourage the scaling up of industries that are strategic in nature or are technology-intensive. The objective is to create the capacity to integrate with the global value chains. Several measures have been taken to reduce transaction costs, especially for the small and medium enterprises as well as facilitate the inflow of capital, technology, and international best practices into the industries. The new CPSE policy provides a road map for disinvestment, opening up avenues for further growth and improvement in efficiency while enabling the government to focus its resources on the developmental needs of the country. The recovery of the industrial sector, positive business expectations propelled by extensive reforms, and improved consumer demand, suggest that further improvements in industrial performance can be expected.

HIGHLIGHTS

  • Index of Industrial Production (IIP) grew at 17.4 percent (YoY) during April-November 2021 as compared to (-)15.3 percent in April-November 2020.
  • Capital expenditure for the Indian railways has increased to Rs. 155,181 crores in 2020-21 from an average annual of Rs. 45,980 crores during 2009-14 and it has been budgeted to further increase to Rs. 215,058 crores in 2021-22 – a five times increase in comparison to the 2014 level.
  • Extent of road construction per day increased substantially in 2020-21 to 36.5 Km per day from 28 Km per day in 2019-20 – a rise of 30.4 percent.
  • Net profit to sales ratio of large corporates reached an all-time high of 10.6 percent in the July-September quarter of 2021-22 despite the pandemic (RBI Study).
  • Introduction of Production Linked Incentive (PLI) scheme, the major boost provided to infrastructure-both physical as well as digital, along with measures to reduce transaction costs and improve ease of doing business, would support the pace of recovery.


ECONOMIC SURVEY 2021-22: CHAPTER 7- AGRICULTURE AND FOOD MANAGEMENT

THE INTRODUCTION: The Agriculture sector which accounts for 18.8 percent of the Gross Value Added (GVA) of the country in 2021-22 has experienced buoyant growth in the past 2 years. It grew at 3.9 percent in 2021-22 and 3.6 percent in 2020-21 showing resilience in the face of COVID-19 shock. The Survey attributes this to “good monsoon, various Government measures to enhance credit availability, improve investments, create the market facility, promote infrastructure development and increased provision of quality inputs to the sector”. It also observes that livestock and fisheries have experienced buoyant growth and had helped the sector perform well.

GROSS VALUE-ADDED AND GROSS CAPITAL FORMATION

  • The share of the agriculture and allied sector in total GVA of the economy has settled at around 18 percent in the long term states the Survey. In the year 2021-22 it is 18.8 percent and in the year 2020-21, it was 20.2 percent. Another trend observed is, higher growth in allied sectors (Livestock, Forestry and Logging, Fishing and Aquaculture) compared to the crop sector. Recognizing these allied sectors as engines of high growth the Committee on Doubling Farmers’ Income (DFI 2018) had also recommended focused policy with a concomitant support system to boost agricultural incomes.
  • There is a direct correlation between capital investments in agriculture and its growth rate. The Gross Capital Formation in the agricultural sector relative to the GVA in the sector is showing a fluctuating trend in sync with the variation in private sector investments, whereas the public sector investments have remained stable at 2-3 percent over the years. The Survey suggests “higher access to institutional credit to farmers and greater participation of the private corporate sector” may improve private sector investment in agriculture. Towards this end, the Survey recommends offering an appropriate policy framework to crowd-in corporate investments along with an increase in public investments along the entire agricultural value chain.

AGRICULTURAL PRODUCTION

  • The Survey states that as per the First Advance Estimates for 2021-22 (Kharif only), total food grain production is estimated at a record level of 150.50 million tonnes, an increase of 0.94 million tonnes over Kharif production in the year 2020-21. Survey also points out that the production of rice, wheat, and coarse cereals had increased at Compound Annual Growth Rates (CAGR) of 2.7, 2.9, and 4.8 percent respectively over the period between 2015-16 and 2020-21. For pulses, oilseeds, and cotton during the same period, it has been 7.9, 6.1, and 2.8 percent respectively.
  • India is the second-largest producer of sugar in the world. India has become a “sugar surplus nation” says the Survey. It points out that since 2010-11, the production has outstripped the consumption except in the year 2016-17.  This has been made possible by ensuring and protecting the sugarcane farmers against price risk through Fair and Remunerative Price (FRP), enhancing the liquidity of mills by incentivizing them to divert excess sugarcane/sugar to ethanol production and provide financial assistance for transportation to sugar mills to facilitate the export of sugar says Survey.

CROP DIVERSIFICATION

  • The existing cropping pattern is skewed towards the cultivation of sugarcane, paddy, and wheat which has led to the depletion of fresh groundwater resources at alarming rates, it also points out that extremely high water stress levels are recorded in the country’s north-western region.
  • To promote water use efficiency and sustainable agriculture and ensure higher incomes to farmers, the Government is implementing the Crop Diversification Programme in the original green revolution States viz., Punjab, Haryana, and Western Uttar Pradesh as a sub-scheme under Rashtriya Krishi Vikas Yojana since 2013-14 to shift area under paddy cultivation towards less water-intensive crops such as oilseeds, pulses, and Nutri-cereals, etc. The program also focuses on shifting areas under tobacco cultivation to alternative crops in States viz. Andhra Pradesh, Bihar, Gujarat, Karnataka, Maharashtra, West Bengal among other tobacco-producing states. The government is also using price policy to signal farmers to diversify their crops.

WATER AND IRRIGATION

  • 60 percent of the net irrigated area in the country is serviced through groundwater. The rate of extraction of groundwater is very high (more than 100%) in the states of Delhi, Haryana, Punjab, and Rajasthan. Noting that increased coverage under micro-irrigation can be the most effective mode of water conservation, the Survey suggests these States need to focus on both medium and long-term groundwater recharge and conservation plans.
  • To mobilize resources to expand coverage of micro-irrigation, a Micro-Irrigation Fund (MIF) with a corpus of Rs. 5000 crores were created under NABARD during 2018-19. As of 01.12.2021, projects with loans under MIF amounting to Rs. 3970.17 crore has been approved for 12.81 lakh hectares of micro-irrigation area. Further, the Survey highlights that under Pradhan Mantri Krishi Sinchayee Yojana, as of 14.12.2021 total area of 59.37 lakh hectares has been covered under micro-irrigation in the country from 2015-to 16.

NATURAL FARMING

  • To sustain agricultural production through eco-friendly processes in tune with nature, ensure chemical-free produce and preserve soil productivity government is also encouraging farmers to adopt natural farming techniques. Towards this end, the government is implementing a dedicated scheme of the Bharatiya Prakritik Krishi Paddhati Programme (BPKP).

AGRICULTURAL CREDIT AND MARKETING

  • The agricultural credit flow for the year 2021-22 has been fixed at Rs. 16,50,000 crores and till 30thSeptember 2021, against this target a sum of Rs.7,36,589.05 crores has been disbursed. Moreover, under the Atma Nirbhar Bharat program, the government also announced an Rs. 2 lakh crore concessional credit boost to 2.5 crore farmers through Kisan Credit Cards (KCC). Towards this end, banks have issued KCCs to 2.70 crore eligible farmers as of 17.01.2022. Further Government has extended the KCC facility to the fisheries and animal husbandry sector in 2018-19.
  • To link the farmers with markets and to help them in trading and realizing competitive and remunerative prices for their produce the government has been working continuously to improve market linkages and marketing infrastructure. Towards this end, the APMCs have been recognized as eligible entities under Agriculture Infrastructure Fund (AIF). Additionally, under the National Agricultural Market (e-NAM) scheme as of 1stDecember 2021, 1000 mandis of 18 States and 3 UTs have been integrated with the e-NAM platform.

  • The Government has also launched a central sector scheme of ‘Formation and Promotion of 10,000 Farmer Producer Organisations (FPOs)’ to form and promote 10,000 FPOs by 2027-28. As of January 2022, a total of 1963 FPOs have been registered under the scheme. The government has also established a full-fledged Ministry of Co-operation in July 2021 to provide a greater focus on the cooperative sector.

NATIONAL MISSION ON EDIBLE OILS

  • India is the world’s second-largest consumer and number one importer of vegetable oil. The oilseed production in India has been steadily growing since 2016-17. It was showing a fluctuating trend before that. It had grown at almost 43 percent from 2015-16 to 2020-21.
  • The demand for edible oil in India would remain high due to population growth, urbanization, and the consequent change in dietary habits and traditional meal patterns.
  • Given the persistently high import of edible oil, to increase oil production the Government had been implementing a centrally sponsored scheme of National Food Security Mission: Oilseeds (NFSM – Oilseeds) since 2018-19 across all districts in the country.
  • The scheme the government has set up 36 oilseed hubs between 2018-19 and 2019-20 to increase the availability of high yielding quality seed. For Kharif 2021, the union government had allocated 9.25 lakhs of oilseed mini kits of high yielding varieties to states for distribution.
  • Further, in August 2021, the Government had launched the National Mission on Edible Oils – Oil Palm (NMEO-OP) to augment the availability of edible oils by “harnessing area expansion and through price incentives”. The scheme aims to cover an additional area of 6.5 lakh hectares for oil palm by 2025-26 and thereby reach a target of 10 lakh hectares ultimately.
  • Currently 3.70 lakh hectares area under oil palm cultivation. Also, the scheme aims to increase the Crude Palm Oil (CPO) production to 11.20 lakh tonnes by 2025-26 and up to 28 lakh tonnes by 2029-30.

FOOD MANAGEMENT

  • India runs one of the largest food management programs in the world. The Survey highlights that during the year 2021-22, the government had allocated 1052.77 lakh tonnes of food grains to States/UTs under the National Food Security Act, 2013, and other welfare schemes compared to 948.48 lakh tonnes in 2020-21.
  • The government has further extended the coverage of food security through the additional provision of 5Kg food grains per person per month through the Pradhan Mantri Gareeb Kalyan Yojana (PMGKY). Under the scheme during 2021-22, the government had allocated 437.37 LMT of food grains and in 2020-21, 322 LMT of food grains free of cost to around 80 crore NFSA beneficiaries to ameliorate the hardships faced by the poor due to economic disruption caused by COVID-19 pandemic.
  • The government had also approved the centrally sponsored pilot scheme ‘Fortification of Rice and its Distribution under PDS’ on 14.02.2019 for three years.
  • The scheme is being implemented in 15 districts (1 district per State) and the government had distributed 3.38 LMT of fortified rice till December 2021 under the pilot scheme.
  • During Kharif Marketing Season (KMS) 2020-21, 601.85 lakh metric tonnes (LMT) of rice have been procured against an estimated target of 642.58 LMT. In the KMS 2021-22, a total of 566.58 LMT of paddy (equivalent to 379.98 LMT rice) was procured as of 16.01.2022. During RMS 2021-22, 433.44 LMT of wheat was procured against 389.92 LMT procured during RMS 2020-21. Also, during the Kharif & Rabi Marketing Season 2020-21, approximately 11.87 LMT of coarse grains has been procured which is the highest in the last five years.

AGRICULTURAL RESEARCH AND EDUCATION

  • Every rupee spent on agricultural research and development, yields much better returns. Increasing R&D spending on agriculture is, therefore, not only a vital necessity for ensuring food security but also important from the socio-economic point of view.
  • Agricultural research and education are crucial for “development of environmentally sustainable global food system, ensuring food and nutrition security and increasing farm income by cost minimization and yield maximization” says the Survey. It points out that the National Agricultural Research System of India has produced significant results. The Indian Council of Agricultural Research (ICAR) during 2020 and 2021 notified/released a total of 731 new varieties/hybrids of field crops. The Department of Agriculture Research and Education (DARE) has developed 35 special trait varieties including bio-fortified and stress-tolerant varieties of field and horticulture crops during 2021-22.

CONCLUSION: The performance of the agriculture and the allied sector has been resilient to the COVID 19 shock. The sector grew at 3.6 percent in 2020-21 and improved to 3.9 percent in 2021- 22. However, as shown by the latest SAS report, the fragmentation of landholdings has led to alternate sources such as livestock, fishery, and wage labor becoming significantly important for an agricultural household. The increasing importance of allied sectors including animal husbandry, dairying, and fisheries in the growth and income of the farmers indicates that focus needs to shift more towards harnessing the potential of allied activities. There is also a need to improve the productivity of small and marginal farmers through the development and implementation of smallholding farm technologies.


ECONOMIC SURVEY 2021-22: CHAPTER 6- SUSTAINABLE DEVELOPMENT AND CLIMATE CHANGE

THE INTRODUCTION: In 2020-21, India progressed further on achieving the Sustainable Development Goals (SDGs). In 2021, India continued exercising significant climate leadership at the international stage under the International Solar Alliance (ISA), Coalition for Disaster Resilient Infrastructure (CDRI), and Leadership Group for Industry Transition (LeadIT Group). The chapter discusses several initiatives taken in the area of sustainable finance by the Ministry of Finance, RBI, and SEBI.

INDIA’S PROGRESS ON SUSTAINABLE DEVELOPMENT GOALS

  • India has been making strides towards achieving the social, economic, and environmental goals covered under SDGs.
  • This achievement gains further significance in the face of the considerable human and economic costs imposed by the COVID-19 pandemic, which has set countries back on their developmental goals and created serious impediments to the attainment of the SDGs, the world over.

GOAL WISE PERFORMANCE OF INDIA AS A WHOLE: NITI AAYOG SDG INDIA INDEX REPORT AND DASHBOARD 2020-21

  • India’s overall score on the NITI Aayog SDG India Index & Dashboard improved to 66 in 2020-21 from 60 in 2019-20 and 57 in 2018-19, showing progress in India’s journey towards achieving the SDGs.
  • Despite 2020-21 being a pandemic year, India performed well on eight of the 15 SDGs measured by the NITI Aayog SDG India Index.
  • These included – goal 3 (good health and well-being), goal 6 (clean water and sanitation), goal 7 (affordable and clean energy), goal 10 (reduced inequalities), goal 11 (sustainable cities and communities), goal 12 (responsible consumption and production), goal 15 (life on land) and goal 16 (peace, justice, and strong institutions).

PERFORMANCE OF STATES AND UTS ON THE NITI AAYOG SDG INDIA INDEX, 2021

  • The number of Front Runners (scoring 65-99) increased to 22 states and UTs in 2020-21 from 10 in 2019-20. All remaining states and UTs were Performers (scoring 50- 64).
  • Amongst states, additions to the Front Runner category in 2020-21 included Uttarakhand, Gujarat, Maharashtra, Mizoram, Punjab, Haryana, and Tripura. Amongst us, additions to the Front Runner category included Andaman and Nicobar Islands, Delhi, Jammu and Kashmir, Ladakh, and Lakshadweep.

STATE OF THE ENVIRONMENT

  • Sustainable development requires balancing rapid economic growth with conservation, ecological security, and environmental sustainability. This section explores the state of the environment across the land, water, and air.

LAND FORESTS

  • Russia, Brazil, Canada, USA, and China were the top five largest countries by forest area in 2020, while India was the tenth-largest country by forest area.
  • The top 10 countries account for 66 percent of the world’s forest area.

  • Forests covered 24 percent of India’s total geographical area accounting for two percent of the world’s total forest area in 2020.
  • India has increased its forest area significantly over the past decade. It ranks third globally in an average annual net gain in forest area between 2010 to 2020, adding an average of 2,66,000 ha of additional forest area every year during the period, or adding approximately 0.38 percent of the 2010 forest area every year between 2010 to 2020.
  • Madhya Pradesh (11 percent of India’s total forest cover) had the largest forest cover in India in 2021, followed by Arunachal Pradesh (9 percent), Chhattisgarh (8 percent), Odisha (7 percent), and Maharashtra (7 percent).
  • Mizoram (85 percent), Arunachal Pradesh (79 percent), Meghalaya (76 percent), Manipur (74 percent), and Nagaland (74 percent) were the top five states in terms of the highest percent of forest cover w.r.t. total geographical area of the state in 2021

PLASTIC WASTE MANAGEMENT AND ELIMINATION OF IDENTIFIED SINGLE-USE PLASTICS

  • India is committed to mitigating pollution caused by littered single-use plastics.
  • In 2018, the Hon’ble Prime Minister announced that India would phase out single-use plastic by 2022.
  • The Hazardous and Other Wastes (Management and Transboundary Movement) Rules, 2016 as amended regulate the import of identified plastic waste into the country by SEZ and EOUs.
  • The regulation of import of plastic waste prevents dumping of plastic waste by other countries in the country and allows for recycling of plastic waste generated in the country.
  • The following domestic regulatory actions have been taken in 2021:
  • In August 2021, the Ministry of Environment, Forest and Climate Change, Government of India, notified the Plastic Waste Management Amendment Rules, 2021 prohibiting identified single-use plastic items, which have low utility and high littering potential, by 2022.
  • The plastic packaging waste, which is not covered under the phase-out of identified single-use plastic items.
  • In October 2021, the Ministry of Environment, Forest, and Climate Change notified the draft Regulations on the Extended Producer Responsibility for plastic packaging under Plastic Waste Management Rules, 2016.

WATER

GROUNDWATER

  • Ground Water Resources Assessment of states/UTs is carried out jointly by state groundwater/ nodal departments and Central Ground Water Board at periodic intervals, and the Dynamic Ground Water Resources of India is published by compiling the state/UT wise groundwater resources assessed.
  • Such groundwater assessments have been undertaken in 2004, 2009, 2011, 2013, 2017, and 2020.
  • The annual groundwater recharge, annual extractable groundwater resources, annual groundwater extraction, and the stage of total groundwater extraction of India during 2004-2020.
  • Overall, the annual groundwater extraction has been in the range of 58-63 percent during this period.

RESERVOIRS

  • Reservoirs are an important source of water resources for the country. However, they are particularly prone to seasonality and are greatly impacted by rainfall and temperature patterns.
  • The capacity at full reservoir levels in 138 monitored reservoirs of India along with the live storage during June-December 2021, June 2020–May 2021, and the ten-year average during June – May.
  • It may be seen that reservoir live storage is at its peak during monsoon months and lowest in summer months, requiring careful planning and coordination of storage, release, and utilization of reservoirs.

RIVERS

  • The Ganga River Basin is the largest in India, covering more than a quarter of the country’s land area, hosting about 43 percent of its population and contributing 28 percent of India’s water resources.
  • The Government of India launched the Namami Gange Mission in 2014 as an integrated and multi-sectoral mission for the conservation of Ganga and its tributaries.

Namami Gange Mission

  • The total expenditure incurred under the Namami Gange Mission from 2014-15 to December 2021. Lower expenditure incurred in 2020-21 and 2021-22 needs to be viewed in the context of the COVID pandemic and recent changes in accounting norms.

  • Under the Gyan Ganga (Research and Knowledge Management) component, the Ganga Knowledge Centre was set up to create a state-of-the-art center to support the NMCG and create a comprehensive knowledge base on Ganga.
  • The Centre for Ganga Management & Study was set up at IIT Kanpur for long-term basin studies and technology development.

AIR

  • The Government of India launched the National Clean Air Programme (NCAP) in 2019 to tackle the air pollution problem comprehensively, with a target to achieve 20-30 percent reduction in particulate matter (PM) concentrations by 2024 across the country keeping 2017 as the base year for the comparison of concentration.
  • The NCAP is implemented in 132 cities, of which 124 cities have been identified based on non-conformity with national ambient air quality standards for five consecutive years.
  • This includes 34 million-plus cities / urban agglomerations identified by the Fifteenth Finance Commission (XV-FC).
  • In addition, NCAP also covers eight other million-plus cities, which fall under the XV-FC grant for receiving performance-based grants for air quality improvement. Figure 26 shows the funds released under the NCAP in 2019-20 and 2020-21.
  • In 2019-20, the highest funds were released to Uttar Pradesh, followed by Maharashtra and Madhya Pradesh while in 2020-21, the highest funds were released to Andhra Pradesh, Punjab, and West Bengal.
  • Several steps are being taken to control and minimize air pollution from various sources in the country, which inter alia include:
  • Vehicular Emission: India has leapfrogged from BS-IV to BS-VI norms for fuel and vehicles since April 2020.
  • Industrial Emission: Stringent emission norms for coal-based thermal power plants have been introduced.
  • Air Pollution due to dust and burning of waste: Six waste management rules covering solid waste, plastic waste, e-waste, bio-medical waste, construction, and demolition waste, and hazardous waste have been notified.
  • Monitoring of Ambient Air Quality: The air quality monitoring network of manual as well as continuous monitoring stations, under programs such as the National Air Monitoring Programme, have been expanded.

AVERAGE ANNUAL AIR QUALITY INDEX, DELHI (2016-2021)

CLIMATE CHANGE

India launched the National Action Plan on Climate Change (NAPCC) in 2008, establishing eight National Missions to advance action on the country’s climate priorities.

NATIONAL MISSIONS UNDER NAPCC

MAJOR DECISIONS AT THE COP26 CLIMATE SUMMIT, GLASGOW

  • The COP26 adopted outcomes on all pending issues of the “Paris Rule Book”, which is the procedures for implementation of the Paris Agreement, including market mechanisms, transparency, and common timeframes for NDCs.
  • The “Glasgow Climate Pact” emphasizes adaptation, mitigation, finance, technology transfer, capacity-building, loss, and damage.
  • The decision urges the developed country Parties to fully deliver on the USD 100 billion mobilization goal urgently and through till 2025 and emphasizes the importance of transparency in the implementation of their pledge.
  • COP26 also welcomed the launch of a comprehensive two-year Glasgow–Sharm el-Sheikh work program on the global goal of adaptation. The Glasgow Dialogue between Parties, relevant organizations, and stakeholders on loss and damage was established to explore the ways to fund loss and damage due to climate change.

India’s NDC and its voluntary commitment to enhanced climate action.

India submitted its Nationally Determined Contribution (NDC) under the Paris Agreement on a “best effort basis” keeping its developmental imperatives in mind. India committed to

  1. Reduce the emission intensity of GDP by 33 to 35 percent by 2030 as compared to the 2005 level.
  2. Create an additional carbon sink of 2.5 to 3 billion tonnes of CO2 equivalent through additional forest and tree cover by 2030.
  3. Achieve about 40 percent cumulative electric power installed capacity from non-fossil fuel energy resources by 2030.

FINANCE FOR SUSTAINABLE DEVELOPMENT

DEALING WITH FINANCIAL RISKS ASSOCIATED WITH CLIMATE CHANGE:

To assess the progress of its regulated entities in managing climate risk, RBI is preparing a consultative discussion paper covering, inter alia,

  1. Governance
  2. Strategy
  3. Risk management
  4. Disclosure

AUGMENTING FINANCE FOR SUSTAINABLE DEVELOPMENT:

  • India is actively contributing to the global efforts towards green finance.
  • RBI joined the Central Banks and Supervisors Network for Greening the Financial System (NGFS) as a member on April 23rd, 2021, and has begun participating in the workstreams of the NGFS.

INDIA’S INITIATIVES AT THE INTERNATIONAL STAGE

Lifestyle for Environment (LIFE):

  • In November 2021, the Hon’ble Prime Minister proposed a One-Word Movement in the context of climate: LIFE – Lifestyle for Environment, at the COP 26 in Glasgow.

International Solar Alliance (ISA):

  • In November 2021, the Hon’ble Prime Minister launched the joint Green Grids Initiative One Sun One World One Grid (GGI –OSOWOG) at the World Leaders’ Summit in Glasgow.

Coalition for Disaster Resilient Infrastructure:

  • India’s call for promoting disaster resilience of infrastructure through the Coalition for Disaster Resilient Infrastructure (CDRI) has been receiving global attention.
  • Since CDRI’s launch in September 2019, its membership has expanded to 28 countries and seven multilateral organizations, with several member countries committing to provide technical assistance and financial resources.

Leadership Group for Industry Transition (LeadIT Group):

  • LeadIT was launched by India and Sweden, with the support of the World Economic Forum at the UN Climate Action Summit in New York in September 2019, as one of the nine action tracks identified by the UN Secretary-General to boost climate ambitions and actions to implement the Paris Agreement.

CONCLUSION: Going forward, there is a need to further improve forest and tree cover. Social forestry could also play a significant role in this regard. States/UTs need to improve management of their groundwater resources through improving its recharge and by stemming its over-exploitation and preventing the critical and semi-critical assessment units from further worsening. There is a greater thrust on climate action following the announcement of India’s target of becoming Net-Zero by 2070. Climate finance will remain critical to successful climate action by developing countries, including India.

HIGHLIGHTS

  • India’s overall score on the NITI Aayog SDG India Index and Dashboard improved to 66 in 2020-21 from 60 in 2019-20 and 57 in 2018-19.
  • Number of Front Runners (scoring 65-99) increased to 22 States and UTs in 2020-21 from 10 in 2019-20.
  • In North-East India, 64 districts were Front Runners and 39 districts were Performers in the NITI Aayog North-Eastern Region District SDG Index 2021-22.
  • India has the tenth largest forest area in the world.
  • In 2020, India ranked third globally in increasing its forest area from 2010 to 2020.
  • In 2020, the forests covered 24% of India’s total geographical, accounting for 2% of the world’s total forest area.
  • In August 2021, the Plastic Waste Management Amendment Rules, 2021, was notified which is aimed at phasing out single-use plastic by 2022.
  • Draft regulation on Extended Producer Responsibility for plastic packaging was notified.
  • The Compliance status of Grossly Polluting Industries (GPIs) located in the Ganga main stem and its tributaries improved from 39% in 2017 to 81% in 2020.
  • The consequent reduction in effluent discharge has been from 349.13 million liters per day (MLD) in 2017 to 280.20 MLD in 2020.
  • The Prime Minister, as a part of the national statement delivered at the 26th Conference of Parties (COP 26) in Glasgow in November 2021, announced ambitious targets to be achieved by 2030 to enable further reduction in emissions.
  • The need to start the one-word movement ‘LIFE’ (Lifestyle for Environment) urging mindful and deliberate utilization instead of mindless and destructive consumption was underlined.