INTERIM BUDGET 2024 — IN CAMPAIGN MODE

THE CONTEXT: The budget reflects the government’s narrative of “transformative growth” during the 2014-24 decade under the Modi administration. However, the focus of welfare schemes and fiscal consolidation may not align with actual spending and resource allocation. The fiscal deficit for 2023-24 is projected to be 5.8% of GDP, marginally below the budgeted level.

THE ISSUES:

  • Introduction of an interim budget: The Interim Budget for 2024-25 was presented due to the upcoming elections, as Prime Minister stated. The Interim Budget is seen as a vote-on-account, which could be perceived as an attempt to influence voters before the elections. This indicates that the budget may not fully reflect the government’s long-term vision and plans.
  • “Transformative growth” narrative: The Economic Survey presented in the budget portrays 2014-2024 as a decade of “transformative growth.” It suggests that previous periods of growth were inadequate, either due to unaddressed structural challenges or unsustainable credit booms.
  • Focus on welfare schemes: The Interim Budget speech primarily focuses on various welfare schemes attributed to the Prime Minister in housing and food. However, apprehensions are raised about these schemes’ implementation and effectiveness, given the discrepancies between the claims and the actual expenditure. For instance, the total food subsidy has fallen from ₹5,41,330 crore in 2020-21 to ₹2,88,060 crore in 2021-22 and a projected ₹2,87,194 crore in 2023-24.
  • Fault lines in spending: A significant deviation exists between the actual expenditure and the revised estimates for schemes such as MGNREGA and PM-KISAN. The budgeted expenditure for MGNREGA was ₹1,57,545 crore for 2023-24. The revised estimates are placed at a higher ₹1,71,069 crore. However, the actual expenditure till December 2023 amounted to only ₹1,07,912 crore, or 63% of the total projected in the revised estimates. The budgeted expenditure for the PM-KISAN scheme was ₹1,15,532 crore for 2023-24. The revised estimate is projected at ₹1,16,789 crore. The actual expenditure till December 2023 was ₹70,797 crore or 61% of the revised estimate.
  • Pre-election blitz: There are two possible interpretations: either the finance minister is inflating the revised estimates to support farmers and rural workers, or the government plans to initiate pre-election spending to gain political advantage.
  • The decline in food subsidies: Despite claims of expanding food support, the data made available by CGA points out that the total food subsidy has declined from 2020-21 to 2021-22 and is projected to decrease further in 2023-24. For instance, the total food subsidy has fallen from ₹5,41,330 crore in 2020-21 to ₹2,88,060 crore in 2021-22 and a projected ₹2,87,194 crore (RE) in 2023-24. This raises concerns about the government’s commitment to food security.
  • Revenue projections and fiscal deficit: The government claims to manage its receipts and keep the fiscal deficit below the budgeted level. There is an expected increase in non-tax revenue receipts, mainly driven by income from dividends and profits. The government expects to raise its non-tax revenue receipts by 25% relative to the budget, with income from dividends and profits slated to rise from ₹99,913 crore in 2022-23 to ₹1,54,407 crore in 2023-24 (RE). However, uncertainties remain regarding the realization of disinvestment proceeds.

THE WAY FORWARD:

  • Enhanced Transparency and Accountability: Implement more rigorous and transparent accounting and reporting practices to ensure that budget estimates, revised estimates, and actual expenditures are accurately reported and easily understandable. Regular audits and public disclosures of government spending can help maintain transparency and accountability, ensuring funds are utilized as intended.
  • Addressing Deviations in Spending: Close monitoring of implementing schemes like MGNREGA and PM-KISAN to ensure that allocated funds are spent within the financial year and reach the intended beneficiaries. Establishing a real-time monitoring system and a dashboard accessible to the public can help track the progress of fund utilization and scheme implementation.
  • Focusing on Effective Implementation of Welfare Schemes: Conduct impact assessments of welfare schemes to evaluate their effectiveness in achieving their goals, such as poverty alleviation and employment generation. Based on the assessments, refine and redesign schemes to make them more effective. Engage with stakeholders, including beneficiaries and local governments, for feedback and suggestions for improvement.
  • Balancing Welfare Spending and Fiscal Prudence: While welfare spending is crucial, it is equally important to maintain fiscal discipline to ensure economic stability. The government could explore innovative financing mechanisms, such as public-private partnerships (PPPs) for infrastructure projects, to reduce the fiscal burden while continuing to invest in critical areas.
  • Strengthening the Food Security System: Address the concerns regarding the decrease in food subsidies and ensure that the National Food Security Act’s objectives are met effectively. Enhance the efficiency of the Public Distribution System (PDS) through technology integration to reduce leakages and ensure the benefits reach the eligible population.
  • Rationalizing Non-Tax Revenue Expectations: Set realistic targets for non-tax revenues, including dividends and profits from PSUs and disinvestment proceeds, to avoid overestimation that could lead to fiscal slippages. A strategic approach to disinvestment focuses on enhancing the value of PSUs before disinvestment and ensuring that disinvestment proceeds are used for productive purposes, such as infrastructure development.
  • Promoting Sustainable Growth: Focus on addressing structural economic challenges to ensure sustainable and inclusive growth. Invest in education, healthcare, and skill development to improve human capital and research and development (R&D) to foster innovation, laying the foundation for long-term economic growth.
  • Fiscal Prudence: The government could focus on maintaining fiscal discipline by avoiding pre-election spending sprees that could undermine the fiscal health of the economy.
  • Public Engagement: Engaging the public and stakeholders in the budget process could help set priorities that reflect the needs and aspirations of the population, leading to more effective and accepted fiscal policies.

THE CONCLUSION:

The interim Budget for 2024-25 reflects a eulogy of the two governments of the last ten years, focusing on welfare schemes and infrastructure spending. However, a closer look at the actual expenditure figures reveals discrepancies and potential pre-election spending blitz. The government’s claims of pro-poor initiatives and fiscal prudence may not align with reality. The impact of these strategies on voters and the upcoming elections remains to be seen.

UPSC PAST YEAR QUESTIONS:

Q.1) Public expenditure management is a challenge to India’s government in budget-making during the post-liberalization period. Clarify it. (2019)

Q.2) One of the intended objectives of Union Budget 2017-18 is to ‘transform, energize and clean India’. Analyse the measures proposed in the Budget 2017-18 to achieve the objective. (2017)

MAINS PRACTICE QUESTION:

Q.1) Discuss the implications of the Interim Budget 2024 on welfare schemes, infrastructure spending, and fiscal deficit.

SOURCE:

https://www.thehindu.com/opinion/lead/interim-budget-2024-in-campaign-mode/article67801178.ece


ECONOMIC SURVEY 2021-22: CHAPTER 10- SOCIAL INFRASTRUCTURE AND EMPLOYMENT

THE INTRODUCTION: The need for a strong and resilient social infrastructure became even more important during the ongoing COVID-19 pandemic that brought into focus the vulnerabilities in social infrastructure across countries. Specifically, the pandemics posed the challenge of balancing livelihoods while saving lives. To save lives and livelihoods amidst the COVID crisis, countries have adopted various strategies. India, the country with the second-largest population and a large elderly population, adopted a multi-pronged approach. The government’s response through ‘Aatmanirbhar Bharat Abhiyan’ packages and other sector-specific initiatives have provided the necessary support to mitigate the adverse impact of a pandemic. This chapter gives a brief account of India’s response to Social Infrastructure and Employment.

INDIA’S HEALTH RESPONSE TO THE COVID-19

Like most other countries, India also faced two COVID-19 waves: the first in 2020 and the second in 2021. To save lives, the Government adopted a multi-pronged approach viz.

  1. Restrictions/partial lockdowns,
  2. Building capacity in health infrastructure,
  3. COVID-19 appropriate behavior, testing, tracing, treatment
  4. Vaccination drive.

COVID VACCINATION STRATEGY

  • Guided by scientific and epidemiological evidence, World Health Organisation (WHO) guidelines, and global best practices, India’s National COVID Vaccination Program has been one of the world’s largest vaccination programs.
  • Government of India procured 75 percent of monthly vaccine production and provided it free to States and UTs, while the rest could be procured by private hospitals.
  • Availability of Vaccine: The ICMR funded the clinical trials of the COVISHIELD vaccine developed in collaboration with Oxford – Astra Zeneca. COVISHIELD and COVAXIN have been widely used vaccines in India. Every month about 250- 275 million doses of COVISHIELD and 50-60 million doses of COVAXIN have been produced.
  • Pricing and equity: At all Government COVID-19 Vaccination Centres (CVCs), the COVID-19 vaccine was made available free of cost for all eligible citizens.
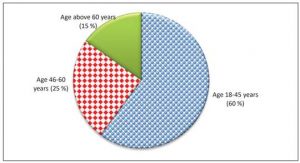
  • Coverage: From 1st May 2021, all 94 crore persons of age 18 years and above, were made eligible for COVID vaccination. From 3rd January 2022, COVID-19 vaccine coverage has been extended to the age group of 15-18 years. Till 19th January 2022, 3.73 crore youngsters between 15-18 age group have been vaccinated with 1st dose of COVID-19 vaccine covering more than 50 percent of youngsters.
  • Vaccine hesitancy: To reduce vaccine hesitancy, the Government made efforts that include awareness by identified experts. From 3rd November 2021, a campaign, ‘Har Ghar Dastak’, has been initiated to identify and vaccinate those who missed 1st dose and are due for 2nd dose through house-to-house mobilization activity.
  • Technology-driven: Arogya Setu mobile app was launched to enable people to assess the risk of their catching the COVID-19 infection.
  • Vaccination Progress: As of 16th January 2022, a total of 156.76 crore doses of COVID-19 vaccines have been administered: 90.75 crores first dose and 65.58 crores second dose.

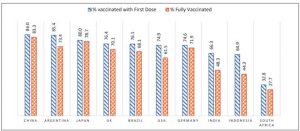
Population vaccinated by country (in percent)

TRENDS IN SOCIAL SECTOR EXPENDITURE

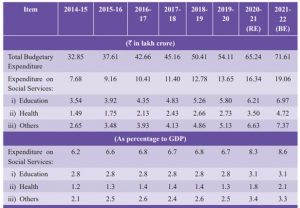
  • Government’s spending on social services increased significantly during the pandemic. In 2021-22 (BE), Centre and State governments earmarked an aggregate of ` 71.61 lakh crore for spending on the social service sector; an increase of 9.8 percent over 2020-21.
  • Last year’s (2020-21) revised expenditure has also gone up by ` 54,000 crores from the budgeted amount. In 2021-22 (BE), funds to the sector increased to 8.6 percent of Gross Domestic Product (GDP) (8.3 percent in 2020-21).
  • During the last five years, social services accounted for about 25 percent of the total Government expenditure (Centre and States taken together). In 2021-22 (BE), it was 26.6 percent.
  • Expenditure in the health sector increased from ` 2.73 lakh crore in 2019-20 (pre-COVID-19) to ` 4.72 lakh crore in 2021-22 (BE), an increase of nearly 73 percent.
  • Union Budget 2021-22, announced Ayushman Bharat Health Infrastructure Mission, a new Centrally Sponsored Scheme, with an outlay of about ` 64,180 crores in the next five years to develop capacities of primary, secondary, and tertiary care Health Systems
  • Union Budget 2021-22 provided an outlay of Rs 35,000 crore towards COVID-19 vaccination.
  • The National Health Policy, 2017 envisaged increasing the government’s health expenditure to 2.5 percent of GDP by 2025.

EDUCATION

  • During initial COVID-19 restrictions, as a precautionary measure to protect the students from COVID-19, schools, and colleges were closed across India. This posed a new challenge for the Government in terms of continuity of education.
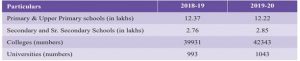
  • School Infrastructure An assessment for the pre-pandemic year of 2019-20 for which data is available reveals that the number of recognized schools & colleges continued to increase between 2018-19 and 2019-20, except for primary & upper primary schools.

SCHOOL INFRASTRUCTURE

  • An assessment for the pre-pandemic year of 2019-20 for which data is available reveals that the number of recognized schools & colleges continued to increase between 2018-19 and 2019-20, except for primary & upper primary schools.

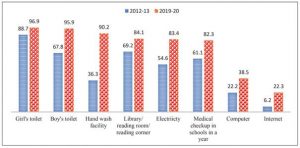
  • Toilets (girls or boys), drinking water, and hand-washing facilities are now available in most Government schools (10.32 lakh).
  • Priority to drinking water and sanitation in schools under Jal Jeevan Mission, Swachh Bharat Mission as well as under Samagra Shiksha Scheme has been instrumental in providing required resources and creating these assets in schools.
  • As of 19.01.2022, under Jal Jeevan Mission 8,39,443 schools were provided a tap water supply.
  • Availability of teachers, measured by Pupil-Teacher Ratio, an indicator whose decrease signals improvement in quality of education, has improved at all levels continuously from 2012-13 to 2019-20: from 34 to 26 at primary, 23 to 18 at upper primary, 30 to 18 at secondary, and 39 to 26 at the higher secondary level.

Schools with Basic Facilities

SCHOOL ENROLMENT

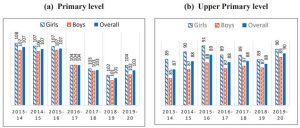
  • In 2019-20, 26.45 crore children were enrolled in schools. During the year, schools enrolled about 42 lakh, additional children, out of which 26 lakh were in primary to higher secondary levels and 16 lakh were in pre-primary as per the Unified District Information System for Education plus (UDISE+) database.
  • The enrollments increased across all levels viz., upper-primary, secondary, and higher secondary, except for the primary level. At the primary level, enrollment reduced from 13.5 crores in 2012-13 to 12.2 crores in 2019-20. This decline in enrollment was because of a decline in the total number of children in the age group 6-10 years.

 School Gross Enrollment Ratios in India (in percent)

SCHOOL DROP-OUT

  • the years 2019-20 saw a decline in dropout rates at primary, upper-primary, and secondary levels. In 2019-20, the school dropout rate at the primary level declined to 1.45 percent from 4.45 percent in 2018-19.
  • ASER found that despite the pandemic, enrollment in the age cohort of 15-16 years continued to improve as the number of not enrolled children in this age group declined from 12.1 percent in 2018 to 6.6 percent in 2021.

Major Initiatives for Students during the COVID-19 pandemic

PM e-VIDYA: Major components

  • One Nation, One Digital Education (DIKSHA) Platform
  • One Class, One TV channel through Swayam Prabha TV Channels
  • Extensive use of Radio, Community Radio, and Podcasts
  • One DTH channel is being operated specifically for hearing impaired students in sign language.

National Digital Education Architecture (NDEAR): A digital infrastructure for Education, was launched on 29th July 2021.

Vidyanjali: To connect the Government and Government aided schools through a community/ volunteer management program.

Major Schemes for School Education during 2021-22

  1. Samagra Shiksha Scheme has been continued for a period of five years, from 2021-22 to 2025-26.
  2. NIPUN Bharat Mission: On 5th July 2021, the government launched a National Mission on Foundational Literacy and Numeracy called “National Initiative for Proficiency in Reading with Understanding and Numeracy (NIPUN Bharat)”.
  3. Pradhan Mantri Poshan Shakti Nirman (PM POSHAN) Scheme: The Scheme, earlier known as the ‘National Programme for Mid-Day Meal in Schools”, covers all school children studying in Balvatika (just before class I) and Classes I-VIII in Government and Government-Aided Schools.

HIGHER EDUCATION

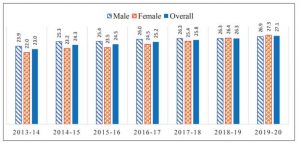
  • Gross enrollment ratio in higher education was recorded at 27.1 percent in 2019-20, slightly higher than 26.3 percent in 2018-19. For males, it has also increased from 26.3 percent in 2018-19 to 26.9 percent in 2019-20 while for females it has increased from 26.4 percent to 27.3 percent respectively.

Gross Enrollment Ratios in Higher Education for age 18-23 years (in percent)

SKILL DEVELOPMENT

  • To unlock the demographic dividend, several steps have been taken to increase the skill levels in the population. Periodic Labour Force Survey (PLFS) 2019-20 shows that formal vocational/technical training among youth (age 15-29 years) and working population (age 15-59 years) have improved in 2019-20 over 2018-19.
  • The improvement in skills has also been for males and females, both in rural and urban sectors. However, formal training for males and females is lower in rural than in urban areas.
  • As per the report of the first quarter (April-June, 2021) of the Quarterly Employment Survey (QES) in respect of establishments employing at least 10 workers in major nine sectors, 17.9 percent of estimated establishments were imparting formal skill training.

SKILL INDIA MISSION

  • Launched in 2015, Skill India Mission focuses on re-skilling and up-skilling in prominent trades. Under the Mission, the government implements Pradhan Mantri Kaushal Vikas Yojana (PMKVY), Jan Shikshan Sansthan (JSS) Scheme, and National Apprenticeship Promotion Scheme (NAPS), for providing short term Skill Development training and Craftsman Training Scheme (CTS), for long term training, to the youth.

Pradhan Mantri Kaushal Vikas Yojana (PMKVY)

  • PMKVY has two training components, viz., Short Term Training (STT) and Recognition of Prior Learning (RPL). Between 2016-17 and 2021-22 (as of 15 January 2022 ), under PMKVY 2.0 about 1.10 crore persons were trained (inclusive of the placement-linked and non-placement-linked components of the PMKVY).

Jan Shikshan Sansthan (JSS) Scheme

  • JSS aims to provide vocational skills to non-literate, neo-literates, persons with a rudimentary level of education up to 8th and school dropouts up to 12th standard in the age group of 15-45 years. The priority groups are women, SC, ST, minorities, Divya Gyan, and other backward sections of the society.

National Apprenticeship Promotion Scheme (NAPS)

  • This Scheme promotes apprenticeship training and the engagement of apprentices by providing financial support to industrial establishments undertaking apprenticeship programs under The Apprentices Act, 1961. As of 31 October 2021, 4.3 lakh apprentices are engaged under the scheme.

Craftsmen Training Scheme (CTS)

  • CTS is for providing long-term training in 137 trades through 14,604 Industrial Training Institutes (ITIs) across the country. For session 2020, 13.36 lakh trainees were enrolled.

 TRENDS OF EMPLOYMENT

In the absence of high-frequency data on labour market indicators, other proxies such as subscriptions to the EPFO scheme and demand for work under MGNREGA, have been used to analyze the more recent trends in employment in urban and rural sectors.

Trends in Urban employment using Quarterly PLFS data

  • In the first quarter of 2020-21, the unemployment rate for the urban sector rose to 20.8 percent. The LFPR and WPR in the urban sector also declined significantly during this quarter.

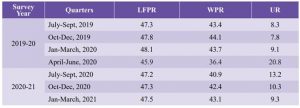
  • The UR gradually declined during this period to reach 9.3 percent in Q4 of 2020-21. The UR for males as well as females, aged 15 & above, recovered to the pre-pandemic levels.

TRENDS IN DATA ON DEMAND FOR WORK UNDER MGNREGS

  • During the nationwide lockdown, the aggregate demand for MGNREGS work peaked in June 2020, and has thereafter stabilized.
  • During the second COVID wave, demand for MGNREGS employment reached the maximum level of 4.59 crore persons in June 2021. Nonetheless, after accounting for seasonality, the demand at an aggregate level still seems to be above the pre-pandemic levels of 2019.
  • For some states like Andhra Pradesh and Bihar, the demand for work under MGNREGS has reduced to below the pre-pandemic levels during the last few months.
  • Intuitively, one may expect that higher MGNREGS demand may be directly related to the movement of migrant labouri. e. source states would be more impacted. Nevertheless, state-level analysis shows that for many migrant source states like West Bengal, Madhya Pradesh, Odisha, Bihar, the MGNREGS employment in most months of 2021 has been slower than the corresponding levels in 2020.
  • In contrast, the demand for MGNREGS employment has been higher for migrant recipient states like Punjab, Maharashtra, Karnataka, and Tamil Nadu for most months in 2021 over 2020.

Long-term trends in employment using annual PLFS data

  • During the Periodic Labour Force Survey (PLFS) 2019-20 (survey period from July 2019 to June 2020), employment at its usual status continued to expand. Between 2018-19 and 2019-20, about 4.75 crore additional persons joined the workforce.
  • This is about three times more than the employment created between 2017-18 and 2018-19.

POLICY RESPONSES TO BOOST RURAL LIVELIHOOD

Incentives for job creation: Aatmanirbhar Bharat Rojgar Yojana (ABRY) was announced as a part of the Aatmanirbhar Bharat 3.0 package to boost the economy, increase the employment generation in the post-Covid recovery phase, and incentivize the creation of new employment along with social security benefits and restoration of loss of employment during COVID-19 pandemic.

Wage employment: To boost employment and livelihood opportunities for returnee migrant workers, Garib Kalyan Rojgar Abhiyaan was launched in June 2020. It focused on 25 target-driven works to provide employment and create infrastructure in the rural areas of 116 districts of 6 States with a resource envelope of Rs 50,000 crore.

Boosting Self-employment:

  • The program targets to mobilize about 9-10 crore households into Self Help Groups (SHGs).
  • Till December 2021, 8.07 crore households are mobilized into SHGs.

Social protection:

  • Pradhan Mantri Shram Yogi Maan-Dhan (PM-SYM) Yojana, launched on 05.03.2019, is a voluntary and contributory pension scheme for providing a monthly minimum assured pension of ` 3000 upon attaining the age of 60 years.
  • As of 17.01.2022, the enrollment under the PMSYM scheme is 46.09 lakh persons, out of which female enrollment was 23.89 lakh and male enrollment was 22.20 lakh.

e-SHRAM Portal

  • e-SHRAM portal has been launched to create a National Database of Unorganized Workers (UWs). One of the main objectives of this portal is to facilitate the delivery of Social Security Schemes to the workers. This database is seeded with Aadhaar and for the age group between 16-59 years.
  • It includes construction workers, migrant workers, gig workers, platform workers, agricultural workers, MGNREGA workers, fishermen, milkmen, ASHA workers, Anganwadi workers, street vendors, domestic workers, rickshaws pullers, and other workers engaged in similar other occupations in the unorganized sector.

Status of Labour Reforms

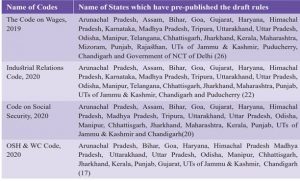
  • In 2019 and 2020, 29 Central Labour laws were amalgamated, rationalized, and simplified into four labor codes, viz., the Code on Wages, 2019 (August 2019), the Industrial Relations Code, 2020, the Code on Social Security, 2020, and the Occupational Safety, Health & Working Conditions Code, 2020 (September 2020).
  • The new laws were in tune with the changing labour market trends and at the same time accommodated the minimum wage requirement and welfare needs of the unorganized sector workers.

HEALTH

PROGRAMMES AND SCHEMES FOR THE HEALTH SECTOR

  • Ayushman Bharat Health and Wellness Centres (AB-HWCs): The vision of Ayushman Bharat is to achieve universal health coverage. It adopts a continuum of care approach, comprising two inter-related components. The first component is the creation of 1,50,000 Health and Wellness Centres (HWCs) which cover both, maternal and child health services and non-communicable diseases, including free essential drugs and diagnostic services.
  • Ayushman Bharat Pradhan Mantri Jan Arogya Yojana (AB-PMJAY): The scheme provides a health cover of ` 5 lakhs per family per year for secondary and tertiary care hospitalization to over 10.74 crores of poor and vulnerable families in the bottom 40 percent of the Indian population.
  • PM-Ayushman Bharat Health Infrastructure Mission (PM-ABHIM) is a mission to develop the capacities of primary, secondary, and tertiary care health systems, strengthen existing national institutions, and create new institutions, to cater to the detection and cure of new and emerging diseases. It is the largest pan-India scheme for public health infrastructure since 2005.
  • Pradhan Mantri Swasthya Suraksha Yojana (PMSSY) is being implemented to correct regional imbalances in the availability of affordable reliable tertiary healthcare services and to augment facilities for quality medical education in the country.
  • Ayushman Bharat Digital Mission (ABDM), erstwhile National Digital Health Mission (NDHM), announced on 27th September 2021 to develop the backbone necessary to support the integrated digital health infrastructure of the country.
  • e-Sanjeevani: In wake of the COVID-19 pandemic, the Ministry of Health and Family Welfare upgraded the thee-Sanjeevani application to enable patient-to-doctor teleconsultation to ensure a continuum of care and facilitate health services to all citizens in the confine of their homes free of cost.

HEALTH OUTCOME INDICATORS

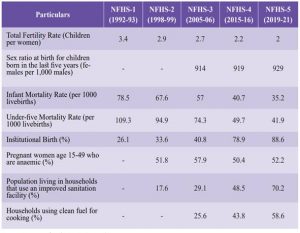
As per the latest National Family Health Survey (NFHS)-5, social indicators such as total fertility rate, sex ratio, and health outcome indicators viz., infant mortality rate, under-five mortality rate, institutional birth rates have improved over the year 2015-16.

CHILD HEALTH INDICATORS
  • All child nutrition indicators have also improved at all Indian levels. Under Five Mortality Rate (U5MR) has declined from 49.7 in 2015-16 to 41.9 in 2019-21. Infant Mortality Rate (IMR) has declined from 40.7 per 1000 live births in 2015-16 to 35.2 per 1000 live births in 2019-21.
  • Stunting has declined from 38 percent in 2015-16 to 36 percent in 2019-21. Wasting has also declined from 21 percent in 2015-16 to 19 percent in 2019-21. And, underweight declined from 36 percent in 2015-16 to 32 percent in 2019-21.
LIFE EXPECTANCY
  • Life expectancy at birth was 69.4 years for the period 2014-18; it has increased by 0.4 years from 2013-17. It varies widely across states; ranging from the lowest at 65.2 years in Chhattisgarh to the highest at 75.3 years in Kerala and Delhi. It is higher in urban areas (72.6 years) than in rural areas (68.0 years).

DRINKING WATER AND SANITATION

JAL JEEVAN MISSION (JJM)
  • In 2019, out of about 18.93 crore families in rural areas, about 3.23 crore (17 percent) rural families had tap water connections in their homes. As of 2 January 2022, 5,51,93,885 households have been provided with a tap water supply since the start of the mission.
  • Six states/ Uts have achieved the coveted status of 100 percent households with tap water supply, namely Goa, Telangana, A & N Islands, Puducherry, Dadra, Nagar Haveli, Daman and Diu, and Haryana.
SWACHH BHARAT MISSION (GRAMEEN) [SBM-G]
  • During 2021-22 (as of 25.10.2021) a total of 7.16 lakh Individual household latrines for new emerging households and 19,061 Community Sanitary Complexes have been constructed. Also, 2,194 villages have been declared as ODF Plus.
  • As per the recently released findings of the fifth round of the National Family Health Survey, 2019-21 (NFHS-5), the population living in households that use an improved sanitation facility has increased from 48.5 percent in 2015-16 to 70.2 percent in 2019-21.
ELECTRICITY AND CLEAN COOKING FUEL
  • As per NFHS-5, 58.6 percent of households were using clean fuel for cooking in 2019-21, a significant increase from 43.8 percent in 2015-16.

RURAL DEVELOPMENT

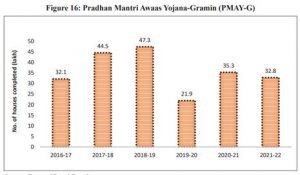
PRADHAN MANTRI AWAAS YOJANA-GRAMIN (PMAY-G)
  • In the first phase from 2016-17 to 2018-19, one crore houses were taken up. Under phase II, assistance is being provided for the construction of the remaining 1.95 crore houses from 2019-20 to 2021-22.
  • As of 18th January 2022, 2.17 crore houses have been sanctioned and 1.69 crore houses completed against a target of 2.63 crore houses till 2021-22.

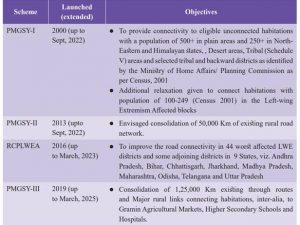
PRADHAN MANTRI GRAM SADAK YOJANA (PMGSY)

  • As of 18.01.2022, a total of 1,82,506 roads measuring 7,82,844 km and 9,456 Long Span Bridges (LSBs) have been sanctioned and 1,66,798 roads measuring 6,84,994 km and 6,404 LSBs have been completed.
  • World Bank (2019) in an evaluation of the scheme found that PMGSY roads had a positive impact on human capital formation in rural India.

MULTIDIMENSIONAL POVERTY (MPI)

  • Using the NFHS-4 (2015-16) report, in line with the global Multidimensional Poverty Index (MPI), NITI Aayog prepared Multidimensional Poverty Index at the national, for all states and districts of India.
  • It will enable measuring deprivation across twelve indicators at the national, state, and districts level. In 2015-16, 25 percent of households were found to be multidimensional poor in India.
  • Among states, Bihar had the largest (51.91%) multidimensional poor households, followed by Jharkhand (42.16%), Uttar Pradesh (37.79%), Madhya Pradesh (36.65%), Assam (32.67%), and Rajasthan (39.46%).
  • Since the MPI index is based on NFHS-4 data of 2014-15, it may serve as the baseline for measuring deprivation in future studies.


ECONOMIC SURVEY 2021-22: CHAPTER 9- SERVICES

THE INTRODUCTION: Services sector contributes over 50 percent to India’s GDP. While the Covid-19 pandemic has hurt most sectors of the economy, the services sector has been the worst affected as its’ share in India’s GVA declined from 55 percent in 2019-20 to 53 percent in 2021-22.1 Within the services sector, the effect of Covid-19 has been varied. While non-contact services such as information, communication, financial, professional, and business services have remained resilient, the impact has been much more severe on contact-based services such as tourism, retail trade, hotel, entertainment, recreation, etc.

IMPACT OF COVID-19 AND SEQUENTIAL RECOVERY

  • The services sector contracted by 8.4 percent Year on Year (YoY) in 2020-21 (Table 1). This decline was driven by a sharp contraction of 18.2 percent YoY in the sub-sector ‘Trade, hotels, transport, communication & services related to broadcasting.
  • Owing to its contact-intensive nature, the services included in this sub-sector had to bear the maximum brunt of the disruptions caused by the prevailing pandemic.
  • The sub-sector ‘Public administration, defense & other services’ includes expenditure by the government and services such as health, education, recreation, etc, on the other, contracted by 4.6 percent YoY in 2020-21.

  • The relatively less contact intensive sub-sector ‘Financial, real estate & professional services’ was the least impacted, with a marginal decline of 1.5 percent YoY in its GVA during 2020-21.

TRENDS IN HIGH-FREQUENCY INDICATORS

The upturn in Services GVA, when seen with the trend in high-frequency indicators such as Purchasing Managers Index (PMI) Services Index, freight and passenger traffic point to a pickup in economic momentum.

SERVICES PMI

  • India’s services sector activity, gauged by PMI services, which had contracted for five consecutive months since March 2020, recovered sharply in October 2020. It dropped again for three consecutive months (May, June, and July 2021) as a consequence of the second Covid-19 wave. Notably, the contraction during May-July 2021 was not as sharp as seen during the first lockdown.
  • With the easing of restrictions, PMI Services started to grow once again from August 2021 recording the strongest jump in over 10 years to 58.4 in October 20213 (Figure 1(a)). PMI index moderated to 55.5 in December 2021.

FREIGHT TRAFFIC

  • As the economy gradually opened up in June 2020, freight traffic also improved. Freight traffic registered strong growth during April- June 2021, partly reflecting the rebound from the low base during the same period last year. The impact of the second covid wave in April-May 2021 on these indicators was much more muted as compared to during the full lockdown in March-May 2020.

BANK CREDIT TO THE SERVICES SECTOR

  • Bank credit growth to the services sector which had moderated significantly in 2019, started picking up in 2020, increasing to 8.8 percent (YoY) at the end of December 2020, as compared to 6.2 percent in December 2019 (Figure 2). This momentum has lost its pace in 2021-22.
  • Bank credit growth decelerated to 3.6 percent YoY at the end of November 2021 as compared to 8.2 percent a year ago. However, it is important to note that corporates have raised more money through capital markets than banking capital in 2021-22 so far.

SERVICES SECTOR SHARES AT THE STATE AND UT LEVEL

  • The services sector accounts for more than 50 percent of the Gross State Value Added (GSVA) in 12 out of the 33 states and UTs (Table 3). Chandigarh stands out with a particularly high share of services in GSVA at 74 percent while Sikkim’s share remains the lowest at 24.25 percent. Notably, the Services share in Sikkim’s GSVA has increased from over 18 percent in 2018-19 to over 24 percent in 2020-21. Similarly, over the last three years, the share of services in GSVA has increased by over 4 percent for Himachal Pradesh and Odisha. Maharashtra and Karnataka are the top two contributors to services GSVA, with Rs 15.1 lakh crore and Rs 9.71 lakh crore gross value added by the services sector in 2020-21 respectively.
  • Due to the Covid-19 pandemic and restrictions on movement, GSVA in the services sector declined in 2020-21 relative to the pre-pandemic year 2019-20. This is true for 13 out of 20 states for which data is available. During 2020-21, services GSVA contracted by almost 11 percent in Rajasthan and almost 10 percent in Jharkhand and Punjab. On the other hand, Sikkim achieved the highest growth of 11.71 percent in services GSVA during 2020-21.

FDI IN SERVICES

  • The Services Sector was the largest recipient of FDI inflows in India. During H1 2021-22, Services Sector received $ 16.73 billion in FDI equity inflows. “Financial, Business, Outsourcing, R&D, Courier, Tech testing & Analysis along with Education sub-sector witnessed strong FDI inflows”, mentioned the Survey.

TRADE-IN SERVICES

  • India had a dominant presence in global services exports. It remained among the top ten services exporter countries in 2020, with its share in world commercial services exports increasing to 4.1% in 2020 from 3.4% in 2019. “The impact of Covid-19 induced global lockdown on India’s services exports was less severe as compared to merchandise exports”.
  • Despite Covid-19’s impact on transport exports, double-digit growth in gross exports of services, aided by exports of software, business, and transportation services, resulting in an increase of 22.8% in net exports of services in H1 2021-22.

SUB-SECTOR WISE PERFORMANCE

IT-BPM (INFORMATION TECHNOLOGY – BUSINESS PROCESS MANAGEMENT) SECTOR

  • IT-BPM sector as a major segment of India’s services. During 2020-21, according to NASSCOM’s provisional estimates, IT-BPM revenues (excluding e-commerce) reached $ 194 billion, growing by 2.26% YoY, adding 1.38 lakh employees.
  • Within the IT-BPM sector, IT services constitute the majority share (>51%). The Economic Survey observed that over the last year, several policy initiatives have been undertaken to drive innovation and technology adoption in the sector, including relaxation of Other Services Provider regulations, Telecom Sector Reforms, and Consumer Protection (e-commerce) Rules, 2020.
  • This would significantly expand access to talent, increase job creation and catapult the sector to the next level of growth and innovation.

STARTUPS AND PATENTS

  • Startups in India had grown remarkably over the last six years, most of which belonged to the Services Sector. More than 61,400 startups have been recognized in India as of January 10, 2022.
  • India had a record number of Startups (44) reaching unicorn status in 2021.
  • intellectual property, specifical patents were key to a knowledge-based economy.
  • The number of patents filed in India has gone up to 58,502 in 2020-21 from 39,400 in 2010-11 and the patents granted in India have gone up to 28,391 from 7,509 during the same period.

Tourism Sector

  • The tourism sector was a major contributor to GDP growth, foreign exchange earnings, and employment, however, the Covid-19 pandemic had a debilitating impact on world travel and tourism everywhere, including India.
  • The resumption of International tourism will continue to depend largely on a coordinated response among countries in terms of travel restrictions, harmonized safety, and hygiene protocols, and effective communication to help restore consumer confidence.
  • Special international flights have been operating under the Vande Bharat Mission which was currently in its 15thphase and had carried over 63.55 lakh passengers.

PORTS, SHIPPING, AND WATERWAYS SERVICES

  • The development of ports was crucial for the economy. Ports handled around 90% of export-import cargo by volume and 70% by value.
  • The total cargo capacity of all ports had increased to 1,246.86 Million Tonnes Per Annum (MTPA) as of March 2021 from 1052.23 MTPA in March 2014.
  • Also, the Port traffic had picked up in 2021-22 registering a growth of 10.16% during April-November 2021, after being hit by disruptions caused by Covid-19 in 2020-21.
  • The Sagarmala Programme, a flagship program, aimed at promoting port-led development in the country with 802 projects worth Rs. 5.53 lakh crore under its ambit.

SPACE SECTOR

  • Since its inception in the 1960s, the Indian space program has grown drastically. Capabilities have been developed in the space sector across all domains including indigenous space transportation systems, space assets comprising a fleet of satellites catering to various needs of the society.
  • The Government undertook various reforms in the space sector in 2020, envisaging participation of the private sector in providing space-based services. These reforms included empowering New Space India Limited (NSIL) and changing the present supply-based model to a demand-driven model; creating an independent nodal agency i.e. Indian National Space Promotion and Authorization Centre (IN-SPACe) under the Department of Space; and providing a predictable, forward-looking, well defined and enabling regulatory regime for space activities in the country.

HIGHLIGHTS

  • GVA of services crossed pre-pandemic level in July-September quarter of 2021-22; however, GVA of contact intensive sectors like trade, transport, etc. still remain below pre-pandemic level.
  • Overall service Sector GVA is expected to grow by 8.2 percent in 2021-22.
  • During April-December 2021, rail freight crossed its pre-pandemic level while air freight and port traffic almost reached their pre-pandemic levels, domestic air, and rail passenger traffic are increasing gradually – showing the impact of the second wave was much more muted as compared to during the first wave.
  • During the first half of 2021-22, the service sector received over US$ 16.7 billion in FDI – accounting for almost 54 percent of total FDI inflows into India.
  • IT-BPM services revenue reached US$ 194 billion in 2020-21, adding 1.38 lakh employees during the same period.
  • Major government reforms include, removing telecom regulations in the IT-BPO sector and opening up of space sector to private players.
  • Services exports surpassed the pre-pandemic level in the January-March quarter of 2020-21 and grew by 21.6 percent in the first half of 2021-22 – strengthened by global demand for software and IT services exports.
  • India has become 3rd largest start-up ecosystem in the world after US and China. The number of newly recognized start-ups increased to over 14000 in 2021-22 from 733 in 2016-17.
  • 44 Indian start-ups have achieved unicorn status in 2021 taking the overall tally of unicorns to 83, most of which are in the services sector.


ECONOMIC SURVEY 2021-22: CHAPTER 8- INDUSTRY AND INFRASTRUCTURE

THE INTRODUCTION: Global Industrial activity continued to be affected by the disruptions caused by the COVID-19 pandemic. While the Indian industry was no exception to these disruptions, its performance has improved in 2021-22. Gradual unlocking of the economy, record vaccinations, improvement in consumer demand, continued policy support towards industries by the government in the form of Atma Nirbhar Bharat Abhiyan, and further reinforcements in 2021-22 have led to an upturn in the performance of the industrial sector. The introduction of the production linked incentive scheme (PLI) to encourage scaling up of industries and a major boost provided to infrastructure-both physical as well as digital– combined with continued measures to reduce transaction costs and improve ease of doing business, would support the pace of recovery.

INDEX OF INDUSTRIAL PRODUCTION (IIP)

  • The impact of the pandemic on the industrial sector is reflected in the negative growth of 8.4 percent in 2020-21. From April-November 2021-to 22 the IIP grew by 17.4 percent as compared to (-15.3) percent in the corresponding period of the previous year.
  • The supply-side measures as also steps to bolster demand, taken to address the contraction, are responsible for the significantly improved performance of the industrial sector in 2021-22.
  • In November 2021 the IIP index grew by 1.4 percent with the mining sector recording a growth of 5.0 percent followed by electricity at 2.1 percent and manufacturing at 0.9 percent.

EIGHT CORE INDEX (ICI)

  • The monthly Index of Eight Core Industries (ICI) measures the collective and individual performance of production in selected eight core industries like Coal, Crude Oil, Natural Gas, Refinery Products, Fertilizers, Steel, Cement, and Electricity. This is an index of the eight most fundamental industrial sectors of the Indian economy and comprises 40.27 percent of the weight in IIP.
  • The growth rate of the ICI index during the period of April-November 2021-22 was 13.7 percent as compared to (-)11.1 percent in the corresponding period of the last financial year. This acceleration in ICI is mainly driven by improved performance in steel, cement, natural gas, coal, and electricity. Fertilizers and crude oil registered a negative growth of 0.6 percent and 2.7 percent respectively.

GROSS FIXED CAPITAL FORMATION

  • Gross fixed capital formation (GFCF) is the gross addition to fixed assets like machinery and equipment, intangible assets and indicates the state of investments in the economy. During 2019-20, the share of the industrial sector in total GFCF in the economy (at current prices) was recorded at 30.1 percent, which is slightly lower than 31 percent in the previous financial year.
  • Within the industrial sector, the share of manufacturing in GFCF was 51 percent, followed by electricity at 23 percent, construction at 21 percent, and mining with 5 percent. While aggregate GFCF (at constant prices) grew by 9.9 percent and industrial GFCF grew by 12.4 percent in 2018-19, it grew by 5.4 percent and 3.7 percent respectively in 2019-20.
  • During 2019-20, GFCF in the mining and electricity sectors registered a negative growth of 12.9 percent and 6 percent respectively, but the GFCF grew by 10.2 and 4.4 percent in the manufacturing and construction sectors respectively on a yo-y basis.

CREDIT IN INDUSTRY

  • Gross bank credit to the industrial sector, recorded a growth of 4.1 percent in October 2021 (Y-o-Y basis) compared to a negative growth of 0.7 growth in October 2020.
  • The share of industry in non-food credit stood at 26 percent in October 2021. Certain industries such as mining, textiles, petroleum, coal products and nuclear fuels, rubber, plastic, and infrastructure have shown consistent improvement in credit growth.

FDI IN INDUSTRIES

  • India registered its highest-ever annual FDI inflow of US$ 81.97 billion (provisional) in 2020-21 reflecting a growth of 10 percent as compared to the previous year.
  • The increase has been on the back of growth of 20 percent in 2019-20. In the year 2021-22, FDI inflow grew by 4 percent in the first six months to reach US$ 42.86 billion as compared to US$ 41.37 billion for the same period of last year.
  • Over the last seven financial years (2014-21), India received FDI inflow worth US$ 440.27 billion which is nearly 58 percent of the FDI received by the country in the last 21 years(US$ 763.83 billion).

PERFORMANCE OF CENTRAL PUBLIC SECTOR ENTERPRISES

  • CPSEs are an important constituent of the Indian industry. As of 31.03.2020, 256 CPSEs were operational. The overall net profit of operating CPSEs during 2019-20 stood at Rs. 93,295 crore Contribution of all CPSEs to the central exchequer by way of excise duty, GST, corporate tax, dividend, etc. stood at Rs. 3,76,425 crore.
  • The CPSEs across sectors employed 14,73,810 persons, of which 9,21,876 were regular employees.
  • By Union Budget 2021-22 announcement, the government has approved a policy of strategic disinvestment of public sector enterprises that will provide a clear roadmap for disinvestment in all non-strategic and strategic sectors.
  • The non-strategic CPSEs will be privatized or otherwise shall be closed. Thus, the policy on public sector enterprises provides a clear path for disinvestment in all nonstrategic and strategic sectors and strengthens the idea of Minimum Government – Maximum Governance.

CORPORATE PERFORMANCE

  • With economic recovery, concomitant improvement in demand and improved business sentiments have had a positive effect on the performance of the corporate sector.
  • In response to the favorable base effect, sales of 1,687 listed manufacturing companies recorded steady and broad-based growth of 34.0 percent in Q2: FY22 as compared to (-)4.3 percent growth in Q2: FY21, on an annual (y-o-y) basis.

SECTOR-WISE PERFORMANCE AND ISSUES IN THE INDUSTRY

Steel: The performance of the steel industry is pivotal for the growth of the economy. Despite being hit by COVID-19, the steel industry has bounced back with cumulative production of crude and finished steel in 2021-22(April-October) at 66.91 MT and 62.37 MT, an increase of 25.0 percent and 28.9 percent respectively.

Coal: Coal is the most important and abundant fossil fuel in India and accounts for 55 percent of the country’s energy needs. Coal production increased by 12.24 percent in April-October 2021 as compared to (-) 3.91 percent in April-October 2020. Overall production of raw coal in India during the year 2020-21 was 716.08 million tonnes (provisional) as compared to 730.87 million tonnes achieved in the previous year 2019-20.

Micro Small Medium Enterprise: Micro, Small & Medium Enterprises(MSMEs) contribute significantly to the economic and social development of the country by fostering entrepreneurship and by generating employment opportunities. The relative importance of MSMEs can be gauged from the fact that the share of MSME GVA in total GVA (current prices) for 2019-20 was 33.08 percent. The CHAMPIONS portal is an ICT-based technology system for making the smaller units big by helping and hand-holding them.

The key features of the portal include:

  • Information dissemination: Regular updates on recent development in the MSME sector.
  • To resolve the grievances in a fast track manner, all Nationalised Banks, a good number of Private/Regional Rural Banks, State Financial Corporations, Central Government Ministries/ Departments, State Governments, and CPSEs have been boarded on the portal.
  • Scheme/Programme-wise mapping of officials of the Ministry for fast-track responses to grievances.
  • Integration with various portals such as MSME Samadhaan, Udyam Registration, CPGRAM, etc.

Textiles: Textile industry is the second-largest employment generator in the country, next only to agriculture. In the last decade, close to Rs. 203,000 crores have been invested in this industry with direct and indirect employment of about 105 million people, a major part of which is women. Despite the industry being deeply affected by the lockdown, it has shown a remarkable recovery with a positive contribution to growth, as reflected by IIP, of 3.6 percent from April-October 2020.

Electronics Industry: Government accords high priority to electronics hardware manufacturing. The government has therefore notified the National Policy on Electronics 2019 (NPE 2019) on 25.02.2019 to position India as a global hub for Electronics System Design and Manufacturing (ESDM) by encouraging and driving capabilities in the country for developing core components, including chipsets. Additionally, NPE 2019 attempts to catalyze the growth of the Indian electronics ecosystem through the

  • Production Linked Incentive (PLI) Schemes for Large Scale Electronics Manufacturing
  • PLI Scheme for IT Hardware
  • Scheme for Promotion of Manufacturing of electronic components and Semiconductors (SPECS)
  • Modified Electronics Manufacturing Clusters 2.0 (EMC 2.0).

Recently, the government has approved an outlay of Rs. 76,000 Crore (>US$ 10 Bn) for the development of the Semiconductors and Display Manufacturing Ecosystem. The government’s intervention to boost this industry has come at a time when the global economy is facing an acute shortage of semiconductors due to severe disruptions in supply chains.

Pharmaceuticals: Indian Pharmaceutical industry ranks third in the world in pharmaceutical production by volume. During 2020-21, total pharma export US$ 24.4 Bn against the total pharma import of US$7.0 Bn. The initiatives taken by the government to address the requirement of the pharmaceutical and medical devices industry are as follows:

  • Bulk Drug Parks that envisages the creation of world-class infrastructure facilities.
  • Bulk drugs have been approved for the promotion of domestic manufacturing of 53 critical APIs.
  • Production linked incentive (PLI) scheme for Pharmaceuticals.
  • Promoting Domestic Manufacturing of Medical Devices was approved on 20th March 2020.

INFRASTRUCTURE

NATIONAL INFRASTRUCTURE PIPELINE (NIP)

  • To achieve a GDP of $5 trillion by 2024-25, India needs to spend about $1.4 trillion over these years on infrastructure. During FYs 2008-17, India invested about US$1.1 trillion in infrastructure. However, the challenge is to step up infrastructure investment substantially.
  • Keeping this objective in view, National Infrastructure Pipeline (NIP) was launched with a projected infrastructure investment of around Rs. 111 lakh crore (US$ 1.5 trillion) during FY 2020-2025 to provide world-class infrastructure across the country and improve the quality of life for all citizens.
  • It also envisages improving project preparation and attracting investment, both domestic and foreign in infrastructure.

NATIONAL MONETISATION PIPELINE (NMP)

  • A robust asset pipeline has been prepared to provide a comprehensive view to investors and developers of the investment avenues in infrastructure. The pipeline includes a selection of de-risked and brownfield assets with a stable revenue generation profile (or long rights) which will make for an attractive investment option.
  • Total indicative value of NMP for core assets of the Central Government has been estimated at Rs 6.0 lakh crore over 4 years (5.4 percent of total infrastructure investment envisaged under NIP).

ROAD TRANSPORT

  • The road network of the country consists of National Highways(NH), State-Highways (SH), District Roads, Rural Roads, Urban Roads, and Project Roads of over 63.71(Provisional) lakh km of roads as of 31 March 2019, which is the second-largest in the world, after the United States with 66.45 lakh km of roads.
  • There has been a consistent increase in the construction of National Highways/roads since 2013-14 with 13,327 km of roads constructed in 2020-21 as compared to 10,237 km in 2019-20, indicating an increase of 30.2 percent over the previous year.

RAILWAYS

  • Being the third-largest network in the world under single management and with over 68,102 route km IR strives to provide a safe, efficient, competitive, and world-class transport system.
  • An average of 1835 track km per year of new track length has been added through new-line and multi-tracking projects during 2014-2021 as compared to the average of 720 track km per day during 2009-14.
  • To strengthen the agriculture sector, as of 31st December 2021, IR has operated 1,841 Kisan Rail services, transporting approximately 6.0 lakh tonnes of perishables including fruits and vegetables.
  • To provide better amenities IR has embarked on providing Wi-Fi internet services at all stations (excluding halt stations). As of 5th December 2021, a total of 6,087 Railway Stations has been equipped with a Wi-Fi facility.

CIVIL AVIATION

  • India has emerged as one of the fastest-growing aviation markets in the world. The domestic traffic in India has more than doubled from around 61 million in 2013-14 to around 137 million in 2019-20, registering a growth of over 14 percent per annum.
  • Till the launching of UDAN in 2016, India had 74 airports have scheduled operations. But, within 4 years under UDAN, four rounds of bidding under RCS-UDAN have taken place and 153 RCS airports including 12 water aerodromes & 36 Helipads have been identified for the operation of RCS flights.

PORTS

  • Port performance in an economy is crucial for the trade competitiveness of that economy. Expansion of port capacity has been accorded the highest priority by the Government through the implementation of well-conceived infrastructure development projects. The capacity of 13 major ports which was 871.52 million tonnes per annum (MTPA) at the end of March 2014, has increased by 79 percent to 1,560.61 MTPA by the end of March 2021.
  • Many initiatives have been taken by the government to improve port governance, augment capacity utilization, enhance port efficiency and connectivity. The measures include the following among others:
  • Sagarmala is a National Programme aimed at accelerating economic development in the country by harnessing the potential of India’s 7,500 km long coastline and 14,500 km of potentially navigable waterways.
  • The Major Port Authorities Act 2021 was notified on 18.2.2021. This act provides for inter alia regulation, operation, and planning of major ports in India and vests the administration, control, and management of such ports upon the Boards of Major Port Authorities.
  • A new Captive Policy for Port Dependent Industries has been prepared to address the challenges of renewal of the concession period, the scope of expansion, and the dynamic business environment.

INLAND WATERWAYS

  • Regulatory amendment through the Inland Vessels Act, 2021, replaced the over 100 years old Inland Vessels Act, 1917 (1 of 1917) and ushered in a new era in the inland water transport sector.
  • Augmentation in navigation capacity of National Waterway-1 (NW-1) is being implemented since 2018 through the Jal Marg Vikas Project from Varanasi to Haldia stretch of the Ganga-Bhagirathi-Hooghly River System to enable large barge movements.
  • Construction of multi-modal terminals at Varanasi and Sahib Ganj has been completed and that of the multimodal terminal at Haldia and the Navigational Lock at Farakka has achieved substantial progress. The other projects such as the comprehensive development of NW-2 and NW-16 &Indo-Bangladesh Protocol (IBP) route are proposed to be undertaken for 5 years for Rs. 461 crores and Rs.145.29 crores respectively, from 2020-21 to 2024-25.

TELECOM

  • The relevance of the telecom sector has increased immensely. This can be gauged from the fact that the total telephone subscriber base in India has increased from 933.02 million in March 2014 to 1200.88 million in March 2021. In March 2021, 45 percent of subscribers were based in rural India and 55 percent in urban areas.
  • Internet penetration in the country is increasing steadily with internet subscribers increasing from 302.33 million in march 2015 to 833.71 million in June 2021. While 67.2 percent of internet subscribers had narrowband connections and 32.8 percent had broadband connections in 2015, the composition had reversed by June 2021 with only 4 percent of subscribers having a narrow band and 96 percent with broadband connections.
  • The number of mobile towers has also increased substantially reaching 6.93 lakhs towers in December 2021, reflecting that the telecom operators have well realized the potential in the sector and seized the opportunity to build up an infrastructure that will be fundamental in boosting the Government’s Digital India campaign.

PETROLEUM, CRUDE, AND NATURAL GAS

  • Crude oil and condensate production during the year 2020-21 was 30.49 million metric tonnes (MMT), lower than the production level of 32.17 MMT in 2019-20 and 94.3 percent of the target of 32.32 MMT for 2020-21. India depends on imports to meet more than 80 percent of its requirements.
  • Natural Gas production during the year 2020-21 was 28.67 billion cubic meters (BCM) as against the production of 31.18 BCM in 2019-20 and 85.4 percent against the target of 33.57 BCM for 2020-21.
  • The production of petroleum products was 233.51 MMT in 2020-21 as against 258.18 MMT in 2019-20, showing achievement of 90.2 percent of the target of 259.02 MMT for 2020- 21.

ELECTRICITY

  • India has witnessed a significant transformation from being an acute power deficit country to a situation of demand being fully met.
  • India has also made remarkable strides to ensure universal access to electricity for every household.
  • The total installed power capacity and captive power plant was 459.15 GW on 31.03.2021 as compared to 446.35 GW on 31.03.2020 registering a growth of 2.87 percent. Installed capacity in utilities was 382.15 GW on 31.03.2021 as compared to 370.11 GW on 31.03.2020 – increasing by 3.25 percent.
  • Thermal sources of energy make the largest – 61.42 percent share of total installed capacity in utilities followed by renewable energy resource (RES) with 24.7 percent and hydro with 12.09 percent.
  • The total electricity generated including that from captive plants during the year 2020-21 was 15.73 lakh GWh as compared to 16.23 lakh GWh during the year 2019-20, of which 13.73 lakh GWh was generated by utilities and 2 lakh GWh in captive plants.

Renewable energy – Solar, Wind, Biomass, and small hydro energy

  • India has witnessed the fastest rate of growth in renewable energy capacity addition among all large economies, during the last 7.5 years with renewable energy capacity growing by 2.9 times and solar energy expanding by over 18 times.
  • To facilitate renewable power evacuation and reshape the grid for future requirements, the Green Energy Corridor (GEC) projects have been initiated. The GEC Project aims at synchronizing electricity produced from renewable sources, such as solar and wind, with conventional power stations in the grid.

THE CONCLUSION: The Government has charted out a comprehensive program for industrial transformation. With an emphasis on supply-side measures, the reforms address long known bottlenecks of insufficient infrastructure, tardy business processes, and labour market reforms. The introduction of the production-linked incentive schemes intends to encourage the scaling up of industries that are strategic in nature or are technology-intensive. The objective is to create the capacity to integrate with the global value chains. Several measures have been taken to reduce transaction costs, especially for the small and medium enterprises as well as facilitate the inflow of capital, technology, and international best practices into the industries. The new CPSE policy provides a road map for disinvestment, opening up avenues for further growth and improvement in efficiency while enabling the government to focus its resources on the developmental needs of the country. The recovery of the industrial sector, positive business expectations propelled by extensive reforms, and improved consumer demand, suggest that further improvements in industrial performance can be expected.

HIGHLIGHTS

  • Index of Industrial Production (IIP) grew at 17.4 percent (YoY) during April-November 2021 as compared to (-)15.3 percent in April-November 2020.
  • Capital expenditure for the Indian railways has increased to Rs. 155,181 crores in 2020-21 from an average annual of Rs. 45,980 crores during 2009-14 and it has been budgeted to further increase to Rs. 215,058 crores in 2021-22 – a five times increase in comparison to the 2014 level.
  • Extent of road construction per day increased substantially in 2020-21 to 36.5 Km per day from 28 Km per day in 2019-20 – a rise of 30.4 percent.
  • Net profit to sales ratio of large corporates reached an all-time high of 10.6 percent in the July-September quarter of 2021-22 despite the pandemic (RBI Study).
  • Introduction of Production Linked Incentive (PLI) scheme, the major boost provided to infrastructure-both physical as well as digital, along with measures to reduce transaction costs and improve ease of doing business, would support the pace of recovery.


ECONOMIC SURVEY 2021-22: CHAPTER 7- AGRICULTURE AND FOOD MANAGEMENT

THE INTRODUCTION: The Agriculture sector which accounts for 18.8 percent of the Gross Value Added (GVA) of the country in 2021-22 has experienced buoyant growth in the past 2 years. It grew at 3.9 percent in 2021-22 and 3.6 percent in 2020-21 showing resilience in the face of COVID-19 shock. The Survey attributes this to “good monsoon, various Government measures to enhance credit availability, improve investments, create the market facility, promote infrastructure development and increased provision of quality inputs to the sector”. It also observes that livestock and fisheries have experienced buoyant growth and had helped the sector perform well.

GROSS VALUE-ADDED AND GROSS CAPITAL FORMATION

  • The share of the agriculture and allied sector in total GVA of the economy has settled at around 18 percent in the long term states the Survey. In the year 2021-22 it is 18.8 percent and in the year 2020-21, it was 20.2 percent. Another trend observed is, higher growth in allied sectors (Livestock, Forestry and Logging, Fishing and Aquaculture) compared to the crop sector. Recognizing these allied sectors as engines of high growth the Committee on Doubling Farmers’ Income (DFI 2018) had also recommended focused policy with a concomitant support system to boost agricultural incomes.
  • There is a direct correlation between capital investments in agriculture and its growth rate. The Gross Capital Formation in the agricultural sector relative to the GVA in the sector is showing a fluctuating trend in sync with the variation in private sector investments, whereas the public sector investments have remained stable at 2-3 percent over the years. The Survey suggests “higher access to institutional credit to farmers and greater participation of the private corporate sector” may improve private sector investment in agriculture. Towards this end, the Survey recommends offering an appropriate policy framework to crowd-in corporate investments along with an increase in public investments along the entire agricultural value chain.

AGRICULTURAL PRODUCTION

  • The Survey states that as per the First Advance Estimates for 2021-22 (Kharif only), total food grain production is estimated at a record level of 150.50 million tonnes, an increase of 0.94 million tonnes over Kharif production in the year 2020-21. Survey also points out that the production of rice, wheat, and coarse cereals had increased at Compound Annual Growth Rates (CAGR) of 2.7, 2.9, and 4.8 percent respectively over the period between 2015-16 and 2020-21. For pulses, oilseeds, and cotton during the same period, it has been 7.9, 6.1, and 2.8 percent respectively.
  • India is the second-largest producer of sugar in the world. India has become a “sugar surplus nation” says the Survey. It points out that since 2010-11, the production has outstripped the consumption except in the year 2016-17.  This has been made possible by ensuring and protecting the sugarcane farmers against price risk through Fair and Remunerative Price (FRP), enhancing the liquidity of mills by incentivizing them to divert excess sugarcane/sugar to ethanol production and provide financial assistance for transportation to sugar mills to facilitate the export of sugar says Survey.

CROP DIVERSIFICATION

  • The existing cropping pattern is skewed towards the cultivation of sugarcane, paddy, and wheat which has led to the depletion of fresh groundwater resources at alarming rates, it also points out that extremely high water stress levels are recorded in the country’s north-western region.
  • To promote water use efficiency and sustainable agriculture and ensure higher incomes to farmers, the Government is implementing the Crop Diversification Programme in the original green revolution States viz., Punjab, Haryana, and Western Uttar Pradesh as a sub-scheme under Rashtriya Krishi Vikas Yojana since 2013-14 to shift area under paddy cultivation towards less water-intensive crops such as oilseeds, pulses, and Nutri-cereals, etc. The program also focuses on shifting areas under tobacco cultivation to alternative crops in States viz. Andhra Pradesh, Bihar, Gujarat, Karnataka, Maharashtra, West Bengal among other tobacco-producing states. The government is also using price policy to signal farmers to diversify their crops.

WATER AND IRRIGATION

  • 60 percent of the net irrigated area in the country is serviced through groundwater. The rate of extraction of groundwater is very high (more than 100%) in the states of Delhi, Haryana, Punjab, and Rajasthan. Noting that increased coverage under micro-irrigation can be the most effective mode of water conservation, the Survey suggests these States need to focus on both medium and long-term groundwater recharge and conservation plans.
  • To mobilize resources to expand coverage of micro-irrigation, a Micro-Irrigation Fund (MIF) with a corpus of Rs. 5000 crores were created under NABARD during 2018-19. As of 01.12.2021, projects with loans under MIF amounting to Rs. 3970.17 crore has been approved for 12.81 lakh hectares of micro-irrigation area. Further, the Survey highlights that under Pradhan Mantri Krishi Sinchayee Yojana, as of 14.12.2021 total area of 59.37 lakh hectares has been covered under micro-irrigation in the country from 2015-to 16.

NATURAL FARMING

  • To sustain agricultural production through eco-friendly processes in tune with nature, ensure chemical-free produce and preserve soil productivity government is also encouraging farmers to adopt natural farming techniques. Towards this end, the government is implementing a dedicated scheme of the Bharatiya Prakritik Krishi Paddhati Programme (BPKP).

AGRICULTURAL CREDIT AND MARKETING

  • The agricultural credit flow for the year 2021-22 has been fixed at Rs. 16,50,000 crores and till 30thSeptember 2021, against this target a sum of Rs.7,36,589.05 crores has been disbursed. Moreover, under the Atma Nirbhar Bharat program, the government also announced an Rs. 2 lakh crore concessional credit boost to 2.5 crore farmers through Kisan Credit Cards (KCC). Towards this end, banks have issued KCCs to 2.70 crore eligible farmers as of 17.01.2022. Further Government has extended the KCC facility to the fisheries and animal husbandry sector in 2018-19.
  • To link the farmers with markets and to help them in trading and realizing competitive and remunerative prices for their produce the government has been working continuously to improve market linkages and marketing infrastructure. Towards this end, the APMCs have been recognized as eligible entities under Agriculture Infrastructure Fund (AIF). Additionally, under the National Agricultural Market (e-NAM) scheme as of 1stDecember 2021, 1000 mandis of 18 States and 3 UTs have been integrated with the e-NAM platform.

  • The Government has also launched a central sector scheme of ‘Formation and Promotion of 10,000 Farmer Producer Organisations (FPOs)’ to form and promote 10,000 FPOs by 2027-28. As of January 2022, a total of 1963 FPOs have been registered under the scheme. The government has also established a full-fledged Ministry of Co-operation in July 2021 to provide a greater focus on the cooperative sector.

NATIONAL MISSION ON EDIBLE OILS

  • India is the world’s second-largest consumer and number one importer of vegetable oil. The oilseed production in India has been steadily growing since 2016-17. It was showing a fluctuating trend before that. It had grown at almost 43 percent from 2015-16 to 2020-21.
  • The demand for edible oil in India would remain high due to population growth, urbanization, and the consequent change in dietary habits and traditional meal patterns.
  • Given the persistently high import of edible oil, to increase oil production the Government had been implementing a centrally sponsored scheme of National Food Security Mission: Oilseeds (NFSM – Oilseeds) since 2018-19 across all districts in the country.
  • The scheme the government has set up 36 oilseed hubs between 2018-19 and 2019-20 to increase the availability of high yielding quality seed. For Kharif 2021, the union government had allocated 9.25 lakhs of oilseed mini kits of high yielding varieties to states for distribution.
  • Further, in August 2021, the Government had launched the National Mission on Edible Oils – Oil Palm (NMEO-OP) to augment the availability of edible oils by “harnessing area expansion and through price incentives”. The scheme aims to cover an additional area of 6.5 lakh hectares for oil palm by 2025-26 and thereby reach a target of 10 lakh hectares ultimately.
  • Currently 3.70 lakh hectares area under oil palm cultivation. Also, the scheme aims to increase the Crude Palm Oil (CPO) production to 11.20 lakh tonnes by 2025-26 and up to 28 lakh tonnes by 2029-30.

FOOD MANAGEMENT

  • India runs one of the largest food management programs in the world. The Survey highlights that during the year 2021-22, the government had allocated 1052.77 lakh tonnes of food grains to States/UTs under the National Food Security Act, 2013, and other welfare schemes compared to 948.48 lakh tonnes in 2020-21.
  • The government has further extended the coverage of food security through the additional provision of 5Kg food grains per person per month through the Pradhan Mantri Gareeb Kalyan Yojana (PMGKY). Under the scheme during 2021-22, the government had allocated 437.37 LMT of food grains and in 2020-21, 322 LMT of food grains free of cost to around 80 crore NFSA beneficiaries to ameliorate the hardships faced by the poor due to economic disruption caused by COVID-19 pandemic.
  • The government had also approved the centrally sponsored pilot scheme ‘Fortification of Rice and its Distribution under PDS’ on 14.02.2019 for three years.
  • The scheme is being implemented in 15 districts (1 district per State) and the government had distributed 3.38 LMT of fortified rice till December 2021 under the pilot scheme.
  • During Kharif Marketing Season (KMS) 2020-21, 601.85 lakh metric tonnes (LMT) of rice have been procured against an estimated target of 642.58 LMT. In the KMS 2021-22, a total of 566.58 LMT of paddy (equivalent to 379.98 LMT rice) was procured as of 16.01.2022. During RMS 2021-22, 433.44 LMT of wheat was procured against 389.92 LMT procured during RMS 2020-21. Also, during the Kharif & Rabi Marketing Season 2020-21, approximately 11.87 LMT of coarse grains has been procured which is the highest in the last five years.

AGRICULTURAL RESEARCH AND EDUCATION

  • Every rupee spent on agricultural research and development, yields much better returns. Increasing R&D spending on agriculture is, therefore, not only a vital necessity for ensuring food security but also important from the socio-economic point of view.
  • Agricultural research and education are crucial for “development of environmentally sustainable global food system, ensuring food and nutrition security and increasing farm income by cost minimization and yield maximization” says the Survey. It points out that the National Agricultural Research System of India has produced significant results. The Indian Council of Agricultural Research (ICAR) during 2020 and 2021 notified/released a total of 731 new varieties/hybrids of field crops. The Department of Agriculture Research and Education (DARE) has developed 35 special trait varieties including bio-fortified and stress-tolerant varieties of field and horticulture crops during 2021-22.

CONCLUSION: The performance of the agriculture and the allied sector has been resilient to the COVID 19 shock. The sector grew at 3.6 percent in 2020-21 and improved to 3.9 percent in 2021- 22. However, as shown by the latest SAS report, the fragmentation of landholdings has led to alternate sources such as livestock, fishery, and wage labor becoming significantly important for an agricultural household. The increasing importance of allied sectors including animal husbandry, dairying, and fisheries in the growth and income of the farmers indicates that focus needs to shift more towards harnessing the potential of allied activities. There is also a need to improve the productivity of small and marginal farmers through the development and implementation of smallholding farm technologies.


THE HIGHLIGHTS OF THE ECONOMIC SURVEY 2021-2022

Economic Survey
THE CONTEXT: The Union Minister for Finance & Corporate Affairs, presented the Economic
Survey 2021-22 in Parliament on 31 January 2022. The highlights of the Economic Survey are as follows:

STATE OF THE ECONOMY

  • Indian economy estimated to grow by 9.2 percent in real terms in 2021-22 (as per first advanced estimates) subsequent to a contraction of 7.3 percent in 2020-21.
  • GDP projected to grow by 8- 8.5 percent in real terms in 2022-23.
  • The year ahead poised for a pickup in private sector investment with the financial system in good position to provide support for economy’s revival.
  • Projection comparable with World Bank and Asian Development Bank’s latest forecasts of real GDP growth of 8.7 percent and 7.5 percent respectively for 2022-23.
  • As per IMF’s latest World Economic Outlook projections, India’s real GDP projected to grow at 9 percent in 2021-22 and 2022-23 and at 7.1 percent in 2023-2024, which would make India the fastest growing major economy in the world for all 3years.
  • Agriculture and allied sectors expected to grow by 3.9 percent; industry by 11.8 percent and services sector by 8.2 percent in 2021-22.
  • On demand side, consumption estimated to grow by 7.0 percent, Gross Fixed Capital Formation (GFCF) by 15 percent, exports by 16.5 percent and imports by 29.4 percent in 2021-22.
  • Macroeconomic stability indicators suggest that the Indian Economy is well placed to take on the challenges of 2022-23.
  • Combination of high foreign exchange reserves sustained foreign direct investment, and rising export earnings will provide adequate buffer against possible global liquidity tapering in 2022-23.
  • Economic impact of “second wave” was much smaller than that during the full lockdown phase in 2020-21, though health impact was more severe.
  • Government of India’s unique response comprised of safety-nets to cushion the impact on vulnerable sections of society and the business sector, significant increase in capital expenditure to spur growth and supply side reforms for a sustained long term expansion.
  • Government’s flexible and multi-layered response is partly based on an “Agile” framework that uses feedback-loops, and the use of eighty High Frequency Indicators (HFIs) in an environment of extreme uncertainty.

Fiscal Developments

  • The revenue receipts from the Central Government (April to November, 2021) have gone up by 67.2 percent (YoY) as against an expected growth of 9.6 percent in the 2021-22 Budget Estimates (over 2020-21 Provisional Actuals).
  • Gross Tax Revenue registers a growth of over 50 percent during April to November, 2021 in YoY terms. This performance is strong compared to pre-pandemic levels of 2019-2020 also.
  • During April-November 2021, Capex has grown by 13.5 percent (YoY) with focus on infrastructure-intensive sectors.
  • Sustained revenue collection and a targeted expenditure policy has contained the fiscal deficit for April to November, 2021 at 46.2 percent of BE.
  • With the enhanced borrowings on account of COVID-19, the Central Government debt has gone up from 49.1 percent of GDP in 2019-20 to 59.3 percent of GDP in 2020-21, but is expected to follow a declining trajectory with the recovery of the economy.

External Sectors

  • India’s merchandise exports and imports rebounded strongly and surpassed preCOVID levels during the current financial year.
  • There was significant pickup in net services with both receipts and payments crossing the pre-pandemic levels, despite weak tourism revenues.
  • Net capital flows were higher at US$ 65.6 billion in the first half of 2021-22, on account of continued inflow of foreign investment, revival in net external commercial borrowings, higher banking capital and additional special drawing rights (SDR) allocation
  • India’s external debt rose to US $ 593.1 billion at end-September 2021, from US $ 556.8 billion a year earlier, reflecting additional SDR allocation by IMF, coupled with higher commercial borrowings.
  • Foreign Exchange Reserves crossed US$ 600 billion in the first half of 2021-22 and touched US $ 633.6 billion as of December 31, 2021.
  • As of end-November 2021, India was the fourth largest forex reserves holder in the world after China, Japan and Switzerland.

Monetary Management and Financial Intermediation

  • The liquidity in the system remained in surplus.
  • Repo rate was maintained at 4 per cent in 2021-22.
  • RBI undertook various measures such as G-Sec Acquisition Programme and Special Long-Term Repo Operations to provide further liquidity.
  • The economic shock of the pandemic has been weathered well by the commercial banking system:
  • YoY Bank credit growth accelerated gradually in 2021-22 from 5.3 per cent in April 2021 to 9.2 per cent as on 31st December 2021.
  • The Gross Non-Performing Advances ratio of Scheduled Commercial Banks (SCBs) declined from 11.2 per cent at the end of 2017-18 to 6.9 per cent at the end of September, 2021.
  • Net Non-Performing Advances ratio declined from 6 percent to 2.2 per cent during the same period
  • Capital to risk-weighted asset ratio of SCBs continued to increase from 13 per cent in 2013-14 to 16.54 per cent at the end of September 2021.
  • The Return on Assets and Return on Equity for Public Sector Banks continued to be positive for the period ending September 2021.
  • Exceptional year for the capital markets:
  • Rs. 89,066 crore was raised via 75 Initial Public Offering (IPO) issues in April-November 2021, which is much higher than in any year in the last decade.
  • Sensex and Nifty scaled up to touch peak at 61,766 and 18,477 on October 18, 2021.
  • Among major emerging market economies, Indian markets outperformed peers in April-December 2021.

Prices and Inflation

The average headline CPI-Combined inflation moderated to 5.2 per cent in 2021-22 (April-December) from 6.6 per cent in the corresponding period of 2020-21.

  • The decline in retail inflation was led by easing of food inflation.
  • Food inflation averaged at a low of 2.9 per cent in 2021-22 (April to December) as against 9.1 per cent in the corresponding period last year.
  • Effective supply-side management kept prices of most essential commodities under control during the year.
  • Proactive measures were taken to contain the price rise in pulses and edible oils.
  • Reduction in central excise and subsequent cuts in Value Added Tax by most States helped ease petrol and diesel prices.

Wholesale inflation based on Wholesale Price Index (WPI) rose to 12.5 per cent during 2021-22 (April to December). This has been attributed to:

  • Low base in the previous year,
  • Pick-up in economic activity,
  • Sharp increase in international prices of crude oil and other imported inputs, and
  • High freight costs.

Divergence between CPI-C and WPI Inflation:

  • The divergence peaked to 9.6 percentage points in May 2020.
  • However, this year there was a reversal in divergence with retail inflation falling below wholesale inflation by 8.0 percentage points in December 2021.

This divergence can be explained by factors such as:

  • Variations due to base effect,
  • Difference in scope and coverage of the two indices,
  • Price collections,
  • Items covered,
  • Difference in commodity weights, and
  • WPI being more sensitive to cost-push inflation led by imported inputs.

With the gradual waning of base effect in WPI, the divergence in CPI-C and WPI is also expected to narrow down.

DOWNLOAD PDF