ECONOMIC SURVEY 2021-22: CHAPTER 6- SUSTAINABLE DEVELOPMENT AND CLIMATE CHANGE

THE INTRODUCTION: In 2020-21, India progressed further on achieving the Sustainable Development Goals (SDGs). In 2021, India continued exercising significant climate leadership at the international stage under the International Solar Alliance (ISA), Coalition for Disaster Resilient Infrastructure (CDRI), and Leadership Group for Industry Transition (LeadIT Group). The chapter discusses several initiatives taken in the area of sustainable finance by the Ministry of Finance, RBI, and SEBI.

INDIA’S PROGRESS ON SUSTAINABLE DEVELOPMENT GOALS

  • India has been making strides towards achieving the social, economic, and environmental goals covered under SDGs.
  • This achievement gains further significance in the face of the considerable human and economic costs imposed by the COVID-19 pandemic, which has set countries back on their developmental goals and created serious impediments to the attainment of the SDGs, the world over.

GOAL WISE PERFORMANCE OF INDIA AS A WHOLE: NITI AAYOG SDG INDIA INDEX REPORT AND DASHBOARD 2020-21

  • India’s overall score on the NITI Aayog SDG India Index & Dashboard improved to 66 in 2020-21 from 60 in 2019-20 and 57 in 2018-19, showing progress in India’s journey towards achieving the SDGs.
  • Despite 2020-21 being a pandemic year, India performed well on eight of the 15 SDGs measured by the NITI Aayog SDG India Index.
  • These included – goal 3 (good health and well-being), goal 6 (clean water and sanitation), goal 7 (affordable and clean energy), goal 10 (reduced inequalities), goal 11 (sustainable cities and communities), goal 12 (responsible consumption and production), goal 15 (life on land) and goal 16 (peace, justice, and strong institutions).

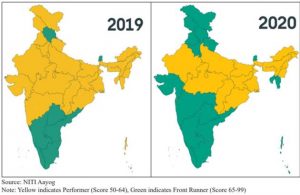
PERFORMANCE OF STATES AND UTS ON THE NITI AAYOG SDG INDIA INDEX, 2021

  • The number of Front Runners (scoring 65-99) increased to 22 states and UTs in 2020-21 from 10 in 2019-20. All remaining states and UTs were Performers (scoring 50- 64).
  • Amongst states, additions to the Front Runner category in 2020-21 included Uttarakhand, Gujarat, Maharashtra, Mizoram, Punjab, Haryana, and Tripura. Amongst us, additions to the Front Runner category included Andaman and Nicobar Islands, Delhi, Jammu and Kashmir, Ladakh, and Lakshadweep.

STATE OF THE ENVIRONMENT

  • Sustainable development requires balancing rapid economic growth with conservation, ecological security, and environmental sustainability. This section explores the state of the environment across the land, water, and air.

LAND FORESTS

  • Russia, Brazil, Canada, USA, and China were the top five largest countries by forest area in 2020, while India was the tenth-largest country by forest area.
  • The top 10 countries account for 66 percent of the world’s forest area.

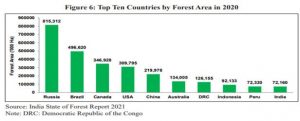
  • Forests covered 24 percent of India’s total geographical area accounting for two percent of the world’s total forest area in 2020.
  • India has increased its forest area significantly over the past decade. It ranks third globally in an average annual net gain in forest area between 2010 to 2020, adding an average of 2,66,000 ha of additional forest area every year during the period, or adding approximately 0.38 percent of the 2010 forest area every year between 2010 to 2020.
  • Madhya Pradesh (11 percent of India’s total forest cover) had the largest forest cover in India in 2021, followed by Arunachal Pradesh (9 percent), Chhattisgarh (8 percent), Odisha (7 percent), and Maharashtra (7 percent).
  • Mizoram (85 percent), Arunachal Pradesh (79 percent), Meghalaya (76 percent), Manipur (74 percent), and Nagaland (74 percent) were the top five states in terms of the highest percent of forest cover w.r.t. total geographical area of the state in 2021

PLASTIC WASTE MANAGEMENT AND ELIMINATION OF IDENTIFIED SINGLE-USE PLASTICS

  • India is committed to mitigating pollution caused by littered single-use plastics.
  • In 2018, the Hon’ble Prime Minister announced that India would phase out single-use plastic by 2022.
  • The Hazardous and Other Wastes (Management and Transboundary Movement) Rules, 2016 as amended regulate the import of identified plastic waste into the country by SEZ and EOUs.
  • The regulation of import of plastic waste prevents dumping of plastic waste by other countries in the country and allows for recycling of plastic waste generated in the country.
  • The following domestic regulatory actions have been taken in 2021:
  • In August 2021, the Ministry of Environment, Forest and Climate Change, Government of India, notified the Plastic Waste Management Amendment Rules, 2021 prohibiting identified single-use plastic items, which have low utility and high littering potential, by 2022.
  • The plastic packaging waste, which is not covered under the phase-out of identified single-use plastic items.
  • In October 2021, the Ministry of Environment, Forest, and Climate Change notified the draft Regulations on the Extended Producer Responsibility for plastic packaging under Plastic Waste Management Rules, 2016.

WATER

GROUNDWATER

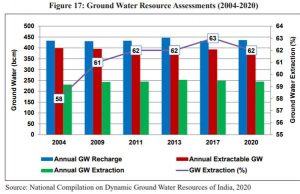
  • Ground Water Resources Assessment of states/UTs is carried out jointly by state groundwater/ nodal departments and Central Ground Water Board at periodic intervals, and the Dynamic Ground Water Resources of India is published by compiling the state/UT wise groundwater resources assessed.
  • Such groundwater assessments have been undertaken in 2004, 2009, 2011, 2013, 2017, and 2020.
  • The annual groundwater recharge, annual extractable groundwater resources, annual groundwater extraction, and the stage of total groundwater extraction of India during 2004-2020.
  • Overall, the annual groundwater extraction has been in the range of 58-63 percent during this period.

RESERVOIRS

  • Reservoirs are an important source of water resources for the country. However, they are particularly prone to seasonality and are greatly impacted by rainfall and temperature patterns.
  • The capacity at full reservoir levels in 138 monitored reservoirs of India along with the live storage during June-December 2021, June 2020–May 2021, and the ten-year average during June – May.
  • It may be seen that reservoir live storage is at its peak during monsoon months and lowest in summer months, requiring careful planning and coordination of storage, release, and utilization of reservoirs.

RIVERS

  • The Ganga River Basin is the largest in India, covering more than a quarter of the country’s land area, hosting about 43 percent of its population and contributing 28 percent of India’s water resources.
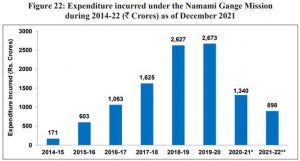
  • The Government of India launched the Namami Gange Mission in 2014 as an integrated and multi-sectoral mission for the conservation of Ganga and its tributaries.

Namami Gange Mission

  • The total expenditure incurred under the Namami Gange Mission from 2014-15 to December 2021. Lower expenditure incurred in 2020-21 and 2021-22 needs to be viewed in the context of the COVID pandemic and recent changes in accounting norms.

  • Under the Gyan Ganga (Research and Knowledge Management) component, the Ganga Knowledge Centre was set up to create a state-of-the-art center to support the NMCG and create a comprehensive knowledge base on Ganga.
  • The Centre for Ganga Management & Study was set up at IIT Kanpur for long-term basin studies and technology development.

AIR

  • The Government of India launched the National Clean Air Programme (NCAP) in 2019 to tackle the air pollution problem comprehensively, with a target to achieve 20-30 percent reduction in particulate matter (PM) concentrations by 2024 across the country keeping 2017 as the base year for the comparison of concentration.
  • The NCAP is implemented in 132 cities, of which 124 cities have been identified based on non-conformity with national ambient air quality standards for five consecutive years.
  • This includes 34 million-plus cities / urban agglomerations identified by the Fifteenth Finance Commission (XV-FC).
  • In addition, NCAP also covers eight other million-plus cities, which fall under the XV-FC grant for receiving performance-based grants for air quality improvement. Figure 26 shows the funds released under the NCAP in 2019-20 and 2020-21.
  • In 2019-20, the highest funds were released to Uttar Pradesh, followed by Maharashtra and Madhya Pradesh while in 2020-21, the highest funds were released to Andhra Pradesh, Punjab, and West Bengal.
  • Several steps are being taken to control and minimize air pollution from various sources in the country, which inter alia include:
  • Vehicular Emission: India has leapfrogged from BS-IV to BS-VI norms for fuel and vehicles since April 2020.
  • Industrial Emission: Stringent emission norms for coal-based thermal power plants have been introduced.
  • Air Pollution due to dust and burning of waste: Six waste management rules covering solid waste, plastic waste, e-waste, bio-medical waste, construction, and demolition waste, and hazardous waste have been notified.
  • Monitoring of Ambient Air Quality: The air quality monitoring network of manual as well as continuous monitoring stations, under programs such as the National Air Monitoring Programme, have been expanded.

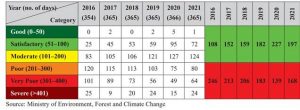
AVERAGE ANNUAL AIR QUALITY INDEX, DELHI (2016-2021)

CLIMATE CHANGE

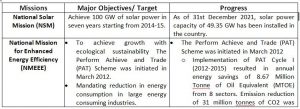
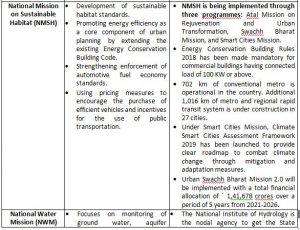
India launched the National Action Plan on Climate Change (NAPCC) in 2008, establishing eight National Missions to advance action on the country’s climate priorities.

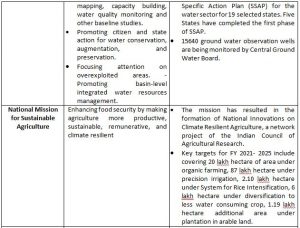
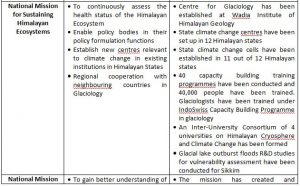
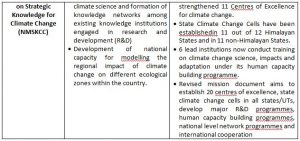
NATIONAL MISSIONS UNDER NAPCC

MAJOR DECISIONS AT THE COP26 CLIMATE SUMMIT, GLASGOW

  • The COP26 adopted outcomes on all pending issues of the “Paris Rule Book”, which is the procedures for implementation of the Paris Agreement, including market mechanisms, transparency, and common timeframes for NDCs.
  • The “Glasgow Climate Pact” emphasizes adaptation, mitigation, finance, technology transfer, capacity-building, loss, and damage.
  • The decision urges the developed country Parties to fully deliver on the USD 100 billion mobilization goal urgently and through till 2025 and emphasizes the importance of transparency in the implementation of their pledge.
  • COP26 also welcomed the launch of a comprehensive two-year Glasgow–Sharm el-Sheikh work program on the global goal of adaptation. The Glasgow Dialogue between Parties, relevant organizations, and stakeholders on loss and damage was established to explore the ways to fund loss and damage due to climate change.

India’s NDC and its voluntary commitment to enhanced climate action.

India submitted its Nationally Determined Contribution (NDC) under the Paris Agreement on a “best effort basis” keeping its developmental imperatives in mind. India committed to

  1. Reduce the emission intensity of GDP by 33 to 35 percent by 2030 as compared to the 2005 level.
  2. Create an additional carbon sink of 2.5 to 3 billion tonnes of CO2 equivalent through additional forest and tree cover by 2030.
  3. Achieve about 40 percent cumulative electric power installed capacity from non-fossil fuel energy resources by 2030.

FINANCE FOR SUSTAINABLE DEVELOPMENT

DEALING WITH FINANCIAL RISKS ASSOCIATED WITH CLIMATE CHANGE:

To assess the progress of its regulated entities in managing climate risk, RBI is preparing a consultative discussion paper covering, inter alia,

  1. Governance
  2. Strategy
  3. Risk management
  4. Disclosure

AUGMENTING FINANCE FOR SUSTAINABLE DEVELOPMENT:

  • India is actively contributing to the global efforts towards green finance.
  • RBI joined the Central Banks and Supervisors Network for Greening the Financial System (NGFS) as a member on April 23rd, 2021, and has begun participating in the workstreams of the NGFS.

INDIA’S INITIATIVES AT THE INTERNATIONAL STAGE

Lifestyle for Environment (LIFE):

  • In November 2021, the Hon’ble Prime Minister proposed a One-Word Movement in the context of climate: LIFE – Lifestyle for Environment, at the COP 26 in Glasgow.

International Solar Alliance (ISA):

  • In November 2021, the Hon’ble Prime Minister launched the joint Green Grids Initiative One Sun One World One Grid (GGI –OSOWOG) at the World Leaders’ Summit in Glasgow.

Coalition for Disaster Resilient Infrastructure:

  • India’s call for promoting disaster resilience of infrastructure through the Coalition for Disaster Resilient Infrastructure (CDRI) has been receiving global attention.
  • Since CDRI’s launch in September 2019, its membership has expanded to 28 countries and seven multilateral organizations, with several member countries committing to provide technical assistance and financial resources.

Leadership Group for Industry Transition (LeadIT Group):

  • LeadIT was launched by India and Sweden, with the support of the World Economic Forum at the UN Climate Action Summit in New York in September 2019, as one of the nine action tracks identified by the UN Secretary-General to boost climate ambitions and actions to implement the Paris Agreement.

CONCLUSION: Going forward, there is a need to further improve forest and tree cover. Social forestry could also play a significant role in this regard. States/UTs need to improve management of their groundwater resources through improving its recharge and by stemming its over-exploitation and preventing the critical and semi-critical assessment units from further worsening. There is a greater thrust on climate action following the announcement of India’s target of becoming Net-Zero by 2070. Climate finance will remain critical to successful climate action by developing countries, including India.

HIGHLIGHTS

  • India’s overall score on the NITI Aayog SDG India Index and Dashboard improved to 66 in 2020-21 from 60 in 2019-20 and 57 in 2018-19.
  • Number of Front Runners (scoring 65-99) increased to 22 States and UTs in 2020-21 from 10 in 2019-20.
  • In North-East India, 64 districts were Front Runners and 39 districts were Performers in the NITI Aayog North-Eastern Region District SDG Index 2021-22.
  • India has the tenth largest forest area in the world.
  • In 2020, India ranked third globally in increasing its forest area from 2010 to 2020.
  • In 2020, the forests covered 24% of India’s total geographical, accounting for 2% of the world’s total forest area.
  • In August 2021, the Plastic Waste Management Amendment Rules, 2021, was notified which is aimed at phasing out single-use plastic by 2022.
  • Draft regulation on Extended Producer Responsibility for plastic packaging was notified.
  • The Compliance status of Grossly Polluting Industries (GPIs) located in the Ganga main stem and its tributaries improved from 39% in 2017 to 81% in 2020.
  • The consequent reduction in effluent discharge has been from 349.13 million liters per day (MLD) in 2017 to 280.20 MLD in 2020.
  • The Prime Minister, as a part of the national statement delivered at the 26th Conference of Parties (COP 26) in Glasgow in November 2021, announced ambitious targets to be achieved by 2030 to enable further reduction in emissions.
  • The need to start the one-word movement ‘LIFE’ (Lifestyle for Environment) urging mindful and deliberate utilization instead of mindless and destructive consumption was underlined.


ECONOMIC SURVEY 2021-22: CHAPTER 5- PRICES AND INFLATION

THE CONTEXT: As economic activity started showing signs of picking up in the second year of the pandemic, the global economy faced the fresh challenge of rising global inflation. COVID-19 related stimulus spending in major economies along with pent-up demand boosting consumer spending pushed inflation up in many advanced and emerging economies. The surge in energy, food, non-food commodities, and input prices, supply constraints, disruption of global supply chains, and rising freight costs across the globe stoked global inflation during the year.

RETAIL INFLATION

The retail inflation, as measured by Consumer Price Index-Combined (CPI-C) moderates to 5.2% in 2021-22 (April-December) from 6.6% in the corresponding period of 2020-21. The Survey also says effective supply-side management kept prices of most essential commodities under control during the year.

DOMESTIC INFLATION

Compared to many Emerging Markets and Developing Economies (EMDEs) and advanced economies, the Survey finds that Consumer Price Index – Combined (CPI-C) inflation in India has remained range-bound in the recent months, touching 5.2% in December 2021. This was possible largely because of the proactive steps taken by the Government for effective supply management.

GLOBAL INFLATION

  • In 2021, inflation picked up globally as economic activity revived with the opening up of economies. Inflation surged from 0.7 % in 2020 to around 3.1 % in 2021 in the advanced economies. For instance, inflation in the USA touched 7.0 % in December 2021, the highest since 1982. In the UK, it hit a nearly 30 years high of 5.4% in December 2021. Among emerging markets, Brazil witnessed inflation of 10.1% in December 2021 and Turkey also saw double-digit inflation touching 36.1%. Argentina has been experiencing inflation rates above 50% during the last 6 months.

RECENT TRENDS IN RETAIL INFLATION

  • Retail inflation, well within the target limits of 2% to 6%, declined to 5.2% as against 6.6% during April – December 2020-21. The Survey states that this was largely attributed due to the easing of food inflation. Food inflation, as measured by the Consumer Food Price Index (CFPI), averaged at a low of 2.9% in 2021-22 (April-December) as against 9.1% in the corresponding period last year.
  • A “refined” Core inflation has been constructed to exclude the volatile fuel items. The items of “petrol for vehicle” and “diesel for vehicle” and “lubricants & other fuels for vehicles”, in addition to “food and beverages” and “fuel and light” have been excluded from headline retail inflation. Since June 2020, refined core inflation has been much below the conventional core inflation, indicating the impact of inflation in fuel items in the “conventional” core inflation measure.

DRIVERS OF RETAIL INFLATION

  • Major drivers of retail inflation have been the “miscellaneous” and “fuel & light” groups. Contribution of miscellaneous increased to 35% in 2021-22 (April – December) from 26.8% in 2020-21 (April – December). According to the Survey, within the miscellaneous group, a subgroup of “transport and Communication” contributed the most, followed by “health”. On the other hand, the contribution of food & beverages declined from 59% to 31.9%.

“FUEL & LIGHT” AND “TRANSPORT & COMMUNICATION”

  • Inflation in the above two groups for the period of 2021-22 (April – December) has been largely due to the high international crude oil, petroleum product prices, and higher taxes.

MISCELLANEOUS

  • Apart from transport & communication; “clothing and footwear” inflation also saw a rising trend during the current financial year possibly indicating higher production and input costs (including imported inputs) as well as due to revival of consumer demand.

FOOD AND BEVERAGES

  • “Oils and fats” contributed around 60% of “food and beverages” inflation despite having a weight of only 7.8% in the group. The demand for edible oils is largely met through imports (60%) and fluctuations in international prices have been responsible for the high inflation in this subgroup. Though India’s imports of edible oils have been the lowest in the last six years, in terms of value, it has increased by 63.5% in 2020-21 as compared to 2019-20.
  • Inflation in pulses declined to 2.4% in December 2021from 16.4% in 2020-21.With an increase in area sown for Kharif pulses to a new high of 142.4 lakh hectares (as of 1stOctober 2021) pulses inflation is on a downward trajectory.

RURAL-URBAN INFLATION DIFFERENTIAL

  • The gap between rural and urban CPI inflation declined in 2020 as compared to the higher gaps witnessed from July 2018 to December 2019. The factor largely responsible for divergence, for brief periods, is the component of food and beverages.

TRENDS IN WHOLESALE PRICE INDEX-BASED INFLATION

  • WPI inflation has shown an increasing trend and has remained high during the current financial year touching 12.5% during 2021-22 (April – December). The Survey describes that part of the high inflation could be because of a low base in the previous year as WPI inflation has been benign during 2020-21.

  • Crude petroleum & natural gas subgroup under WPI has witnessed very high inflation and stood at 55.7% in December 2021. Within manufactured food products, edible oils were a major contributor.

DIVERGENCE BETWEEN WPI AND CPI-BASED INFLATION RATES

  • The Survey attributes a host of factors for the divergence witnessed between the two indices. Some of them, amongst others, include the variations due to base effect, the conceptual difference in their purpose and design, the price behavior of the different components of the two indices, and lagging demand pick up. The Survey states that with the gradual waning of base effect in WPI its divergence in WPI and CPI inflation is expected to narrow down.

HOUSING PRICES

  • The residential housing sector was also affected by COVID-19 induced restrictions through both supply and demand channels.
  • Amidst initial COVID-19 restrictions, not only did the construction of new houses slow down but the launch of new housing projects also got delayed. With the loss of income, uncertainty about future income, and stay-at-home orders, home buyers delayed their housing purchases.
  • During the second COVID-19 wave (April-June, 2021), transactions of housing properties were once again impacted adversely, but not as much as it was seen during the first COVID-19 wave (April-June, 2020).

PHARMACEUTICAL PRICING

  • Several steps have been taken to ensure the affordability of drugs and medical devices. Ceiling prices for 355 medicines and 886 formulations were fixed for medicines under the National List of Essential Medicines, 2015 until 31 December 2021.
  • Retail prices for approximately 1798 formulations were fixed under DPCO, 2013 till 31 December 2021.
  • During the recent years, exercising extraordinary powers under DPCO, 2013 in the public interest, prices of coronary stents and knee implants have also been fixed.
  • NPPA also capped the trade margin up to 30 percent on selected 42 anti-cancer non-schedule medicine on a pilot basis in February 2019.

LONG TERM PERSPECTIVE

  • Given the importance of supply-side factors in having a predominance in the determination of inflation in India, certain long-term policies are likely to help. This includes changing production patterns which would lead to diversification of production of crops, calibrated import policy to address uncertainty, and increased focus on transportation and storage infrastructure for perishable commodities.
  • Better storage and supply chain management is required to ensure availability in lean season and reduced wastages of horticulture and other perishable essential commodities to reduce the seasonal spikes in prices for consumers, glut for the farmers in times of good harvests due to lack of marketing infrastructure, resulting in distress sales.
  • Effective utilization of the Agriculture Infrastructure Fund for investment in viable projects for post-harvest management infrastructure for perishable commodities can help improve agriculture infrastructure in the country.
  • Schemes like Operation Green and Kisan Rail need to be exploited further to protect the interests of the farmers as well as the consumers.

HIGHLIGHTS

  • The average headline CPI-Combined inflation moderated to 5.2 percent in 2021-22 (April-December) from 6.6 percent in the corresponding period of 2020-21.
  • The decline in retail inflation was led by the easing of food inflation.
  • Food inflation averaged at a low of 2.9 percent in 2021-22 (April to December) as against 9.1 percent in the corresponding period last year.
  • Effective supply-side management kept prices of most essential commodities under control during the year.
  • Proactive measures were taken to contain the price rise in pulses and edible oils.
  • Reduction in central excise and subsequent cuts in Value Added Tax by most States helped ease petrol and diesel prices.
  • Wholesale inflation based on the Wholesale Price Index (WPI) rose to 12.5 percent during 2021-22 (April to December).
  • This has been attributed to:
  • Low base in the previous year,
  • Pick-up in economic activity,
  • Sharp increase in international prices of crude oil and other imported inputs, and
  • High freight costs.
  • Divergence between CPI-C and WPI Inflation:
  • The divergence peaked to 9.6 percentage points in May 2020.
  • However, this year there was a reversal in divergence with retail inflation falling below wholesale inflation by 8.0 percentage points in December 2021.
  • This divergence can be explained by factors such as:
  • Variations due to base effect,
  • Difference in scope and coverage of the two indices,
  • Price collections,
  • Items covered,
  • Difference in commodity weights, and
  • WPI being more sensitive to cost-push inflation led by imported inputs.


THE HIGHLIGHTS OF THE ECONOMIC SURVEY 2021-2022

Economic Survey
THE CONTEXT: The Union Minister for Finance & Corporate Affairs, presented the Economic
Survey 2021-22 in Parliament on 31 January 2022. The highlights of the Economic Survey are as follows:

STATE OF THE ECONOMY

  • Indian economy estimated to grow by 9.2 percent in real terms in 2021-22 (as per first advanced estimates) subsequent to a contraction of 7.3 percent in 2020-21.
  • GDP projected to grow by 8- 8.5 percent in real terms in 2022-23.
  • The year ahead poised for a pickup in private sector investment with the financial system in good position to provide support for economy’s revival.
  • Projection comparable with World Bank and Asian Development Bank’s latest forecasts of real GDP growth of 8.7 percent and 7.5 percent respectively for 2022-23.
  • As per IMF’s latest World Economic Outlook projections, India’s real GDP projected to grow at 9 percent in 2021-22 and 2022-23 and at 7.1 percent in 2023-2024, which would make India the fastest growing major economy in the world for all 3years.
  • Agriculture and allied sectors expected to grow by 3.9 percent; industry by 11.8 percent and services sector by 8.2 percent in 2021-22.
  • On demand side, consumption estimated to grow by 7.0 percent, Gross Fixed Capital Formation (GFCF) by 15 percent, exports by 16.5 percent and imports by 29.4 percent in 2021-22.
  • Macroeconomic stability indicators suggest that the Indian Economy is well placed to take on the challenges of 2022-23.
  • Combination of high foreign exchange reserves sustained foreign direct investment, and rising export earnings will provide adequate buffer against possible global liquidity tapering in 2022-23.
  • Economic impact of “second wave” was much smaller than that during the full lockdown phase in 2020-21, though health impact was more severe.
  • Government of India’s unique response comprised of safety-nets to cushion the impact on vulnerable sections of society and the business sector, significant increase in capital expenditure to spur growth and supply side reforms for a sustained long term expansion.
  • Government’s flexible and multi-layered response is partly based on an “Agile” framework that uses feedback-loops, and the use of eighty High Frequency Indicators (HFIs) in an environment of extreme uncertainty.

Fiscal Developments

  • The revenue receipts from the Central Government (April to November, 2021) have gone up by 67.2 percent (YoY) as against an expected growth of 9.6 percent in the 2021-22 Budget Estimates (over 2020-21 Provisional Actuals).
  • Gross Tax Revenue registers a growth of over 50 percent during April to November, 2021 in YoY terms. This performance is strong compared to pre-pandemic levels of 2019-2020 also.
  • During April-November 2021, Capex has grown by 13.5 percent (YoY) with focus on infrastructure-intensive sectors.
  • Sustained revenue collection and a targeted expenditure policy has contained the fiscal deficit for April to November, 2021 at 46.2 percent of BE.
  • With the enhanced borrowings on account of COVID-19, the Central Government debt has gone up from 49.1 percent of GDP in 2019-20 to 59.3 percent of GDP in 2020-21, but is expected to follow a declining trajectory with the recovery of the economy.

External Sectors

  • India’s merchandise exports and imports rebounded strongly and surpassed preCOVID levels during the current financial year.
  • There was significant pickup in net services with both receipts and payments crossing the pre-pandemic levels, despite weak tourism revenues.
  • Net capital flows were higher at US$ 65.6 billion in the first half of 2021-22, on account of continued inflow of foreign investment, revival in net external commercial borrowings, higher banking capital and additional special drawing rights (SDR) allocation
  • India’s external debt rose to US $ 593.1 billion at end-September 2021, from US $ 556.8 billion a year earlier, reflecting additional SDR allocation by IMF, coupled with higher commercial borrowings.
  • Foreign Exchange Reserves crossed US$ 600 billion in the first half of 2021-22 and touched US $ 633.6 billion as of December 31, 2021.
  • As of end-November 2021, India was the fourth largest forex reserves holder in the world after China, Japan and Switzerland.

Monetary Management and Financial Intermediation

  • The liquidity in the system remained in surplus.
  • Repo rate was maintained at 4 per cent in 2021-22.
  • RBI undertook various measures such as G-Sec Acquisition Programme and Special Long-Term Repo Operations to provide further liquidity.
  • The economic shock of the pandemic has been weathered well by the commercial banking system:
  • YoY Bank credit growth accelerated gradually in 2021-22 from 5.3 per cent in April 2021 to 9.2 per cent as on 31st December 2021.
  • The Gross Non-Performing Advances ratio of Scheduled Commercial Banks (SCBs) declined from 11.2 per cent at the end of 2017-18 to 6.9 per cent at the end of September, 2021.
  • Net Non-Performing Advances ratio declined from 6 percent to 2.2 per cent during the same period
  • Capital to risk-weighted asset ratio of SCBs continued to increase from 13 per cent in 2013-14 to 16.54 per cent at the end of September 2021.
  • The Return on Assets and Return on Equity for Public Sector Banks continued to be positive for the period ending September 2021.
  • Exceptional year for the capital markets:
  • Rs. 89,066 crore was raised via 75 Initial Public Offering (IPO) issues in April-November 2021, which is much higher than in any year in the last decade.
  • Sensex and Nifty scaled up to touch peak at 61,766 and 18,477 on October 18, 2021.
  • Among major emerging market economies, Indian markets outperformed peers in April-December 2021.

Prices and Inflation

The average headline CPI-Combined inflation moderated to 5.2 per cent in 2021-22 (April-December) from 6.6 per cent in the corresponding period of 2020-21.

  • The decline in retail inflation was led by easing of food inflation.
  • Food inflation averaged at a low of 2.9 per cent in 2021-22 (April to December) as against 9.1 per cent in the corresponding period last year.
  • Effective supply-side management kept prices of most essential commodities under control during the year.
  • Proactive measures were taken to contain the price rise in pulses and edible oils.
  • Reduction in central excise and subsequent cuts in Value Added Tax by most States helped ease petrol and diesel prices.

Wholesale inflation based on Wholesale Price Index (WPI) rose to 12.5 per cent during 2021-22 (April to December). This has been attributed to:

  • Low base in the previous year,
  • Pick-up in economic activity,
  • Sharp increase in international prices of crude oil and other imported inputs, and
  • High freight costs.

Divergence between CPI-C and WPI Inflation:

  • The divergence peaked to 9.6 percentage points in May 2020.
  • However, this year there was a reversal in divergence with retail inflation falling below wholesale inflation by 8.0 percentage points in December 2021.

This divergence can be explained by factors such as:

  • Variations due to base effect,
  • Difference in scope and coverage of the two indices,
  • Price collections,
  • Items covered,
  • Difference in commodity weights, and
  • WPI being more sensitive to cost-push inflation led by imported inputs.

With the gradual waning of base effect in WPI, the divergence in CPI-C and WPI is also expected to narrow down.

DOWNLOAD PDF